Introduction
Nitrogen (N) is the nutrient most frequently supplied by fertilization and is used in the largest amount by grass plants. Establishing grass on sand-based systems is problematic because N is leached easily from sand and soluble N sources need to be applied frequently to establish grasses. Because slow-release fertilizers release relatively small amounts of N over long periods of time, they have been considered a good choice for sand-based systems. Sand-based systems have improved resistance to the negative effects of compaction on root aeration and they reduce player injury (Li et al., 2009). However, soil fertility management of sand-based root zones can be a problem because of the low cation exchange capacity (CEC) of sand. Shaw and Andrews (2001) reported that sand-based root zones often have a CEC of 2 cmol kg-1 or less. Most N used by grass is taken up by the root system in either the ammonium (NH4+) or nitrate (NO3-) form. Nitrogen is released from organic N sources as NH4+ by soil microorganisms through a process called mineralization. The NH4+ released by soil microbes is rapidly transformed through the process of nitrification to NO2- and then into the NO3- form. Since NO3- is an anion it readily leaches from the root zone in sand-based systems. Soils with low CEC do not provide the capacity to hold other cations for plant nutrition.
The fundamental concept of a slow-release fertilizer is that it releases its nutrients at a more gradual rate that allows maximum uptake and use by plants and minimizes losses due to leaching, volatilization, or unnecessary turf growth (Sartain, 2002). This may reduce the number of fertilizer applications required to maintain plant growth at a desired level and allow greater rates of product to be applied in a single application. Slow- and controlled-release N sources have been investigated to diminish leaching potential under various soil conditions and to provide management benefits such as reduced foliar burn potential, controlled growth, reduced N leaching, and lower labor costs (Fry et al., 1993). Guertal and Howe (2012) reported the ranking of leaching time for 3 N sources and untreated control. The ranking was urea ≥urea+urease/nitrification inhibitor≥polymer coated urea=untreated control. Barton and Colmer (2006) found that the slow-release N had greater color than the fast-release N during the winter months. Methylene urea is a class of slow-release N fertilizer that has been widely promoted over the last four decades (Sartain, 2002). Methylene ureas used in the turf industry predominantly contain intermediate-chain-length polymers. The total N content of a methylene urea polymer is 39 to 40% N, with between 25 and 60% of the N present as cold-water insoluble N (CWIN) (Christians, 1998). Unreacted urea N content generally is in the range of 15 to 30% of total N.
Nitrogen use efficiency (NUE) is known to be affected by N source, rate (Fry et al., 1993; Hummel and Waddington, 1981; McCarty et al., 1994), placement of fertilizer within the soil profile (Doran, 1980; Jansson and Persson, 1982; Soper et al., 1971; Tomar and Soper 1981), and environmental factors such as seasonal temperature (Lee et al., 2003), irrigation management, and soil texture (Miller, 2012; Spalding and Exner, 1993). The NUE has been studied widely in barley (Gonzalez Ponce et al., 1993), cotton (Stevens et al., 1996), maize (Qingfeng et al., 2016; Szczepaniak, 2016; Tsai et al., 1992), pearl millet (Alagarswamy et al., 1988), rice (Cassman et al., 1993), and wheat (Rao and Dao, 1996), however, very little information is available on NUE for turfgrass growth at the present time.
Nitrogen use efficiency for turf is defined as dry matter produced per unit N present in clippings from field-grown cool-season turfgrasses (Liu et al., 1993). According to their report, NUE did not differ significantly among cultivars of the same species. However, NUE of urea-based fertilizers depends on placement. Surface applications may increase volatilization and immobilization compared to deeper placements (Doran, 1980). Deep placement of N, however, can reduce volatilization and immobilization losses by reducing N contact with dead and decomposing plant residues (Doran, 1980). Tomar and Soper (1981) reported that deep placement application of N fertilizers produced 20% more N use efficiency than surface application. However, deeper placement may also increase the N loss from leaching if excessive irrigation or rainfall is received (Srinivas and Popham, 1999).
The objective of this study was to compare urea and methylene urea applied at 146 and 293 kg N ha-1 and at four mixing depths (0, 7.6, 15.2, and 22.9 cm) in a sand-based system by measuring clipping dry weight, root dry weight, root organic matter, total Kjeldahl nitrogen (TKN) in clippings and NO3-N leachate.
Materials and Methods
These studies were conducted for 12-week in a greenhouse at Iowa State University, Ames, Iowa. The first study was conducted from November 2002 to January 2003, and the second from March 2003 to June 2003. Methylene urea (Nutralene® 40-0-0, KOCH, Wichita, USA) was the slow-release N source and urea (46-0-0) the fast-release source. Both materials were evaluated at 146 and 293 kg N ha-1, at placement depths of 0, 7.6, 15.2, and 22.9 cm. Surface applied urea was added weekly at 12.17 and 24.42 kg N ha-1, giving a total of 146 and 293 kg N ha-1 during the 12-week study period.
Local mason sand that met the United States Golf Association (USGA) specification was used as the growing medium (USGA Green Section Staff, 1993). The sand was packed into a 7.62 cm diameter polyvinyl chloride (PVC) pipe lined with a clear plastic tube. Total energy of 3.03 J cm-2 was used for compaction of root zone. The PVC pipe was capped at the bottom and the plastic tube tied off at the base with fine holes punched to facilitate drainage. The root zone depth was 30.5 cm and the holding tube was 38.1 cm long. The columns were sodded with mature sod of ‘unique’ Poa pratensis L. that was field-grown on a 15 cm pad of USGA-type sand and harvested from the research station at Iowa State University, Ames, Iowa. The sod was washed free of sand before planting in the prepared treatment tubes. Greenhouse temperature during the night and day was 19.4-22.2℃, respectively. The average light level during the 16 hr photoperiod in the greenhouse was 858.8 μE m-2 sec-1.
Pellett and Roberts (1963) nutrient solution designed for cool-season grasses without N was used to provide proper levels of other essential elements in the root zone. The N fertilizers were applied on 4 November 2002, and 17 March 2003, respectively. Grass clippings were collected from each tube at approximately two-week intervals. The clippings were oven-dried at a temperature of 67℃ for 24 h and weighed. At the end of the study, root dry weight was determined by washing and oven-drying samples at 67℃ for 24 h (Steyn, 1959).
Root organic matter was also measured at the end of the study. Oven-dried roots were ashed at 490℃ for 8 h in a muffle furnace and then weighed to determine organic matter (Jones and Case, 1990). All leachate solution was collected from a cup under the PVC pipe for final nutrient analysis. Nitrate nitrogen of the leachate was analyzed by using the cadmium-reduction method (Bremner, 1965). This procedure was conducted by flow injection analysis (Smith and Scott, 1990). Total leaf N was determined by using a modified micro-Kjeldahl (TKN) digestion procedure (Jones, 1991; Nelson and Sommers, 1980) in combination with a nitroprusside-salicylate (Wall et al., 1975) using flow injection analysis (Smith and Scott, 1990).
The equation for NUE was calculated as:
NUE equation for clipping yield
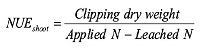 (1)
(1)
NUE equation for root yield
 (2)
(2)
NUE equation for total grass mass
 (3)
(3)
The experimental design was a randomized complete block with a factorial arrangement of two N sources, two N rates, and four N mixing depths. All parameters were analyzed using the factorial arrangement except root weights. Since root weights were split into three sampling depths root dry weight and root organic matter were treated as sub-plots.
The data analyzed using the t-test procedures and mean separation was performed by standard error of difference (SED) method of the Statistical Analysis System (SAS, 1987). PROC MIXED was used for multiple factor analyses of variance.
Results
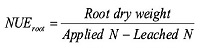
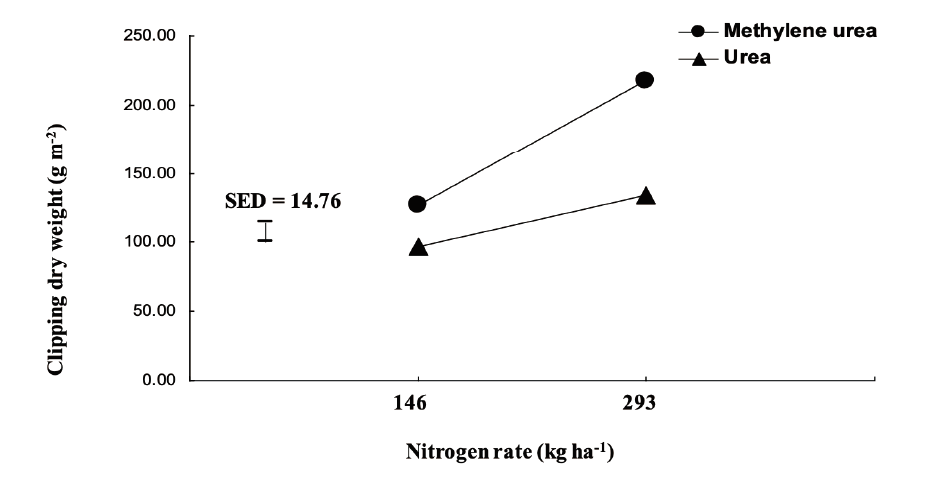
There was an interaction between N source and rate and between N source and mixing depth for total clipping dry weight (Table 1). Methylene urea at the 146 and 293 kg N ha-1 rates produced 31 and 62% more clipping dry weight than urea at the same rates, respectively (Fig. 1). Methylene urea applied at the 7.6 cm mixing depth generated 200% more clipping dry weight than urea at the same mixing depth (Fig. 2). Methylene urea applied at 15.2 and 22.9 cm also produced 106 and 111% more clipping dry weight than urea at the same mixing depth, respectively. However, urea applied on the surface created 21% more clipping dry weight than methylene urea applied to the surface. Greater N rate and methylene urea application at rootzone placement produced more clipping dry weight except the surface application of urea.
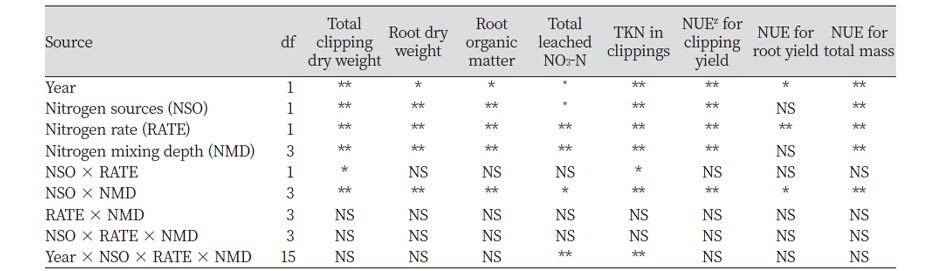
Root dry weight and root organic matter varied with N sources and mixing depths (Table 1). When urea and methylene urea were placed on 7.6, 15.2, and 22.9 cm, significant differences were not found for root dry weight (Table 2). There were significant differences for root dry weight when urea and methylene urea were placed on the surface. Methylene urea at the 7.6, 15.2, and 22.9 cm mixing depth resulted in 32-43% more total root dry weight than urea at the same mixing depths, respectively. However, when applied on the surface, urea generated 17% more total root dry weight than methylene urea.
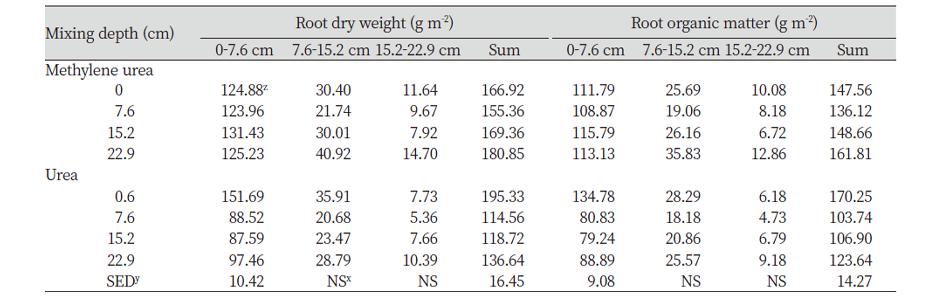
The same trends were found for root organic matter (Table 2). With the exception of surface application, methylene urea resulted in 27-45% more root organic matter in the 0 to 7.6 cm layer. Surface applied urea produced 21% more root organic matter in the 0 to 7.6 cm depth than methylene urea. Methylene urea at the 7.6, 15.2, and 22.9 cm mixing depth also resulted in 31-39% more total root organic matter than urea at the same mixing depths.
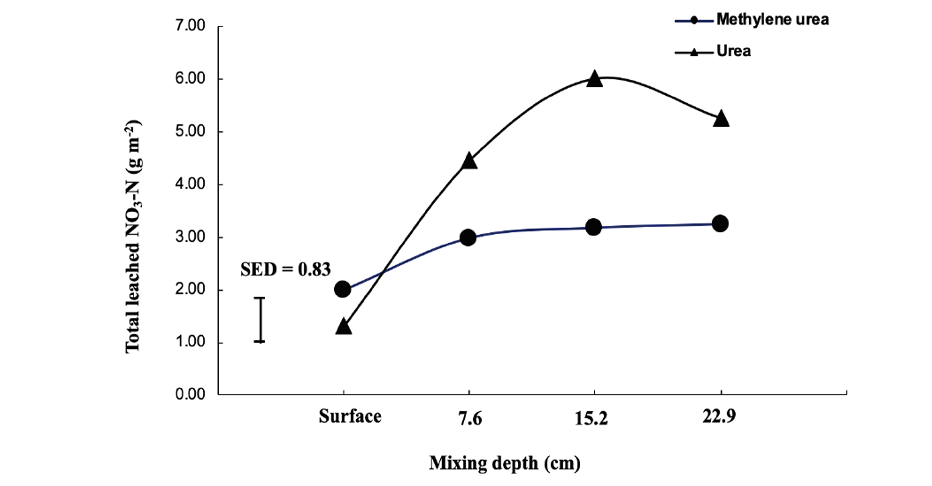
There was a significant interaction between N source and mixing depth for total leached NO3-N (Table 1). Both urea and methylene urea were not significantly different when surface applied, but the greatest N was leached by urea at the mixing depth of 15.2 cm (Fig. 3). At the mixing depth of 22.9 cm, difference between N leached from the application of urea and methylene urea was reduced compared to the mixing depth of 15.2 cm.
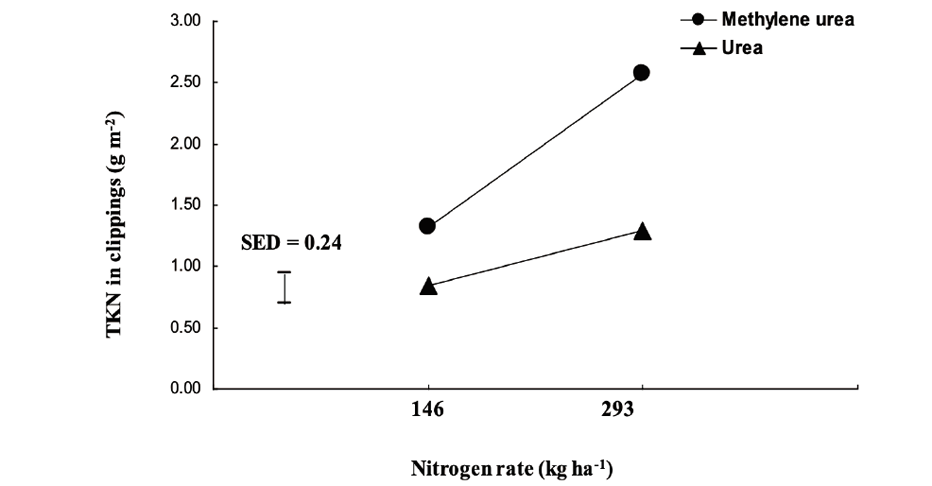
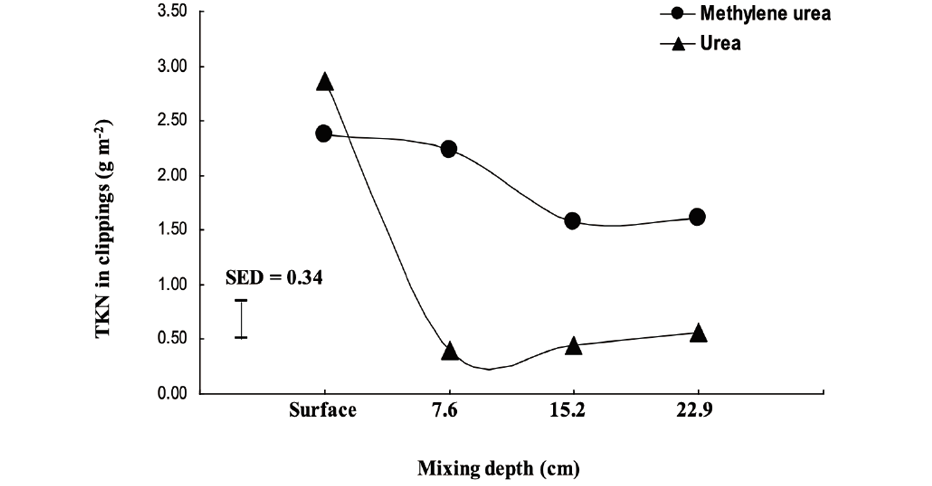
Total Kjedahl N (TKN) in clippings varied between N source and N rate, and between N source and mixing depth (Table 1). Methylene urea at 146 and 293 kg N ha-1 resulted in 57 and 99% more TKN in clippings than urea at the same rate, respectively (Fig. 4). Methylene urea at the 7.6, 15.2, and 22.9 cm mixing depth generated 463, 246, and 190% more TKN in clippings than urea at the same mixing depth, respectively (Fig. 5). However, surface applied urea resulted in 21% more TKN in clippings than methylene urea applied on the surface.
Nitrogen use efficiency (NUE) for clipping yield, root yield, and total mass yield varied with N source and mixing depth (Table 1). For clipping yield, surface applied urea had 25% higher efficiency per unit N than methylene urea, however methylene urea had 73-92% higher efficiency than urea applied at deeper mixing depths (Fig. 6). The NUE trend of urea was similar for both clipping yield and root yield. Both were more efficient when applied on the surface and less efficient with increasing mixing depths. In contrast, the trend of NUE with methylene urea was different between clipping yield and root yield. Clipping yield NUE for methylene urea was greatest when applied to the surface but decreased at mixing depths deeper than 7.6 cm (Fig. 6). However, NUE of roots was the lowest when surface applied and greatest as the deepest mixing depth, 22.9 cm (Fig. 7). For total mass yield, surface applied urea had the largest efficiency (23.75 g g-1) among the treatments (Fig. 8). However, methylene urea with deeper mixing depths had 32-45% more efficiency per unit N than urea.
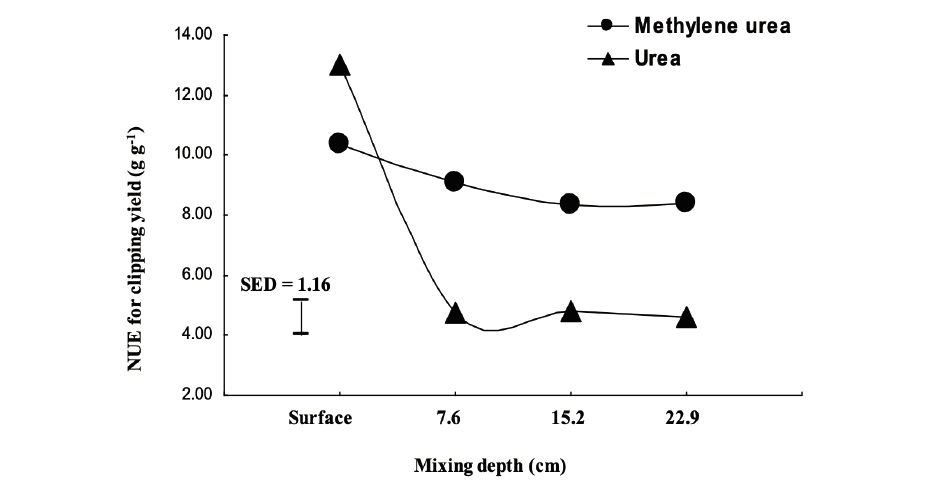
Fig. 6. Mean N use efficiency (NUE) for clipping yield (g g-1) per unit column of ‘Unique’ Poa pratensis L. by N source and mixing depth. Each mean was calculated from 16 observations (four replications × two N rate levels × two years). The vertical bar represents the standard error of difference (SED).
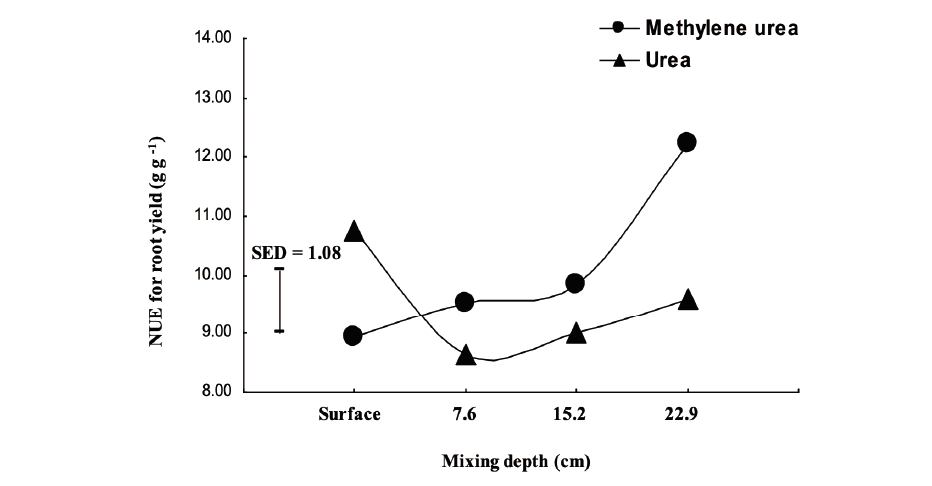
Fig. 7. Mean N use efficiency (NUE) for clipping yield (g g-1) per unit column of ‘Unique’ Poa pratensis L. by N source and mixing depth. Each mean was calculated from 16 observations (four replications × two N rate levels × two years). The vertical bar represents the standard error of difference (SED).
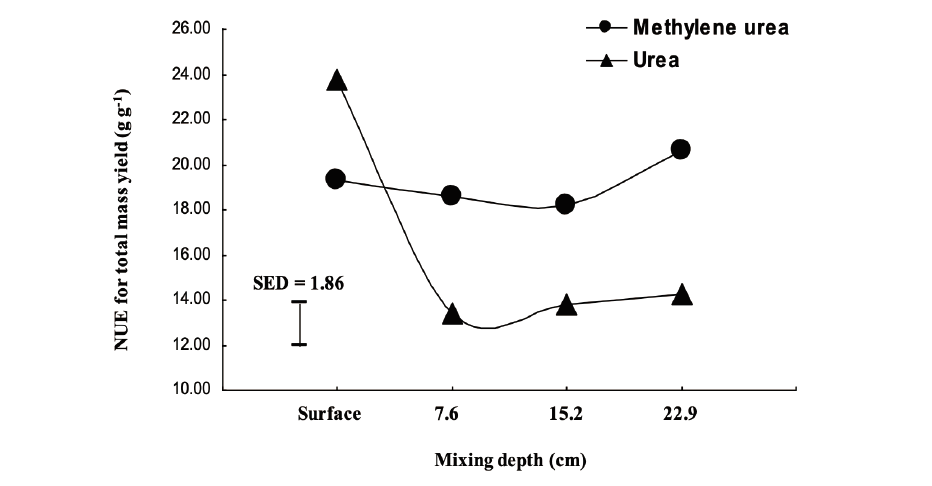
Fig. 8. Mean N use efficiency (NUE) for clipping and root yield (g g-1) per unit column of ‘Unique’ Poa pratensis L. by N source and mixing depth. Each mean was averaged from 16 observations (four replications × two N rate levels × two years). The vertical bar represents the standard error of difference (SED).
Discussion
The application of methylene urea resulted in less NUE for total mass yield than urea when both were surface applied. However, when fertilizer was mixed into the rootzone NUE for total mass yield was greater for methylene urea compared to urea, a onetime application.
The largest shoot and root yield were obtained when split applications of urea were applied on the surface. This result agrees with Ottman and Pope (2000) who found that the best management practices for N fertilization includes split applications of N timed according to plant needs. We found that more shoot and root growth were observed with increasing depth of methylene urea placement compared to urea, although the application of methylene urea resulted in less shoot and root growth than urea when both were surface applied. According to Doran (1980), surface applications may increase volatilization and immobilization compared to deeper placements. Deep placement of N can reduce volatilization and immobilization losses by reducing N contact with dead and decomposing plant residues. Our results indicated that methylene urea with deep placement is more effective for total mass growth of grass than urea. This may mean methylene urea results in more N uptake by grass and may have less N loss than urea. This conclusion is supported by our observation that both urea and methylene urea were similar when surface applied but more N was leached by urea as mixing depth increased (Fig. 3). These findings are consistent with those of other researchers who have studied N leaching from grass systems. Sartain and Gooding (2000) reported that the combination of ammonium nitrate and Milorganite® resulted in the leaching of approximately 17% of the applied N. isobutylidine diurea (IBDU) as a slow-release source reduced the N loss by about 10% of applied N. Snyder et al. (1984) also discovered that NO3-N leaching from bermudagrass fertilized at 5g N m-2 per month with sulfur coated urea (SCU) did not exceed the EPA standard of 10 mg L-1. Irrigation water with a high solubleNO3-N produced leachate concentrations three to seven times larger than the EPA standard during the period of 10 to 25 d after treatment.
The best NUE for clipping yield and total mass yield were found with a split application of urea to the surface, even though methylene urea had more NUE than urea as mixing depth increased (Fig. 6 and Fig. 8). The best NUE for root yield was achieved by methylene urea placed at 22.9 cm. However, NO3-N leaching was greater from surface applied urea than from deep placement of methylene urea (Table 2 and Fig. 3). The reason that methylene urea at the 22.9 cm mixing depth produced more root dry weight than methylene urea at other mixing depths is uncertain. Tomar and Soper (1981) reported that deep placement of N fertilizers produced 20% more N use efficiency than surface applications for root dry weight. However, deeper placement may also increase the N loss from leaching if excessive irrigation or rainfall is received (Srinivas and Popham, 1999). Even though subsurface placement can often increase fertilizer NUE and plant response, it may also increase the potential for leaching if excessive irrigation or rainfall is received after the fertilizer N is converted to NO3 but before it is taken up by the plant (Rao and Popham, 1999).
Split applications of urea on the surface produced the largest clipping yield and the best NUE for total mass yield, with the lowest NO3-N loss due to leaching. Methylene urea at the 22.9 cm mixing depth resulted in more grass growth, smallerNO3-N losses, and better NUE for total mass than urea placed in the media subsurface. While repeat applications of urea produced the best results, this treatment requires more labor than incorporating methylene urea in the media. Perhaps combination of the two treatments including a subsurface incorporation of methylene urea with surface applications of urea during the growing period would be the best recommendation for Kentucky bluegrass sod establishment on sand-based systems. More research will be needed to verify the effects of these combined treatments.