Changes in Hyperspectral Characteristics According to Weed Density in a Soybean Field

Research Article
황 혜린  Hye-Rin Hwang1정 재경  Jae-Gyeong Jung2홍 세실  Se-Sil Hong2송 기은  Ki-Eun Song1홍 선희  Sun-Hee Hong3심 상인  Sang-In Shim1,4*

Abstract

This study was conducted to investigate the effect of competition with various weed densities on crop plants in soybean fields. As the density of weed decreased, the biomass production of soybeans increased, and the soybean yield was also high in plots with low weed occurrence density. The weed species that were dominant in the field were Cyperus iria, Eclipta prostrata, Portulaca oleracea, Mollugo pentaphylla, Galinsoga parviflora, Acalypha australis, and Amaranthus retroflexus. The diversity of weeds was lower in the plot in which weed density was lowered. The hyperspectral reflectance by weed density was different not only in soybean but also in weeds and was affected by the time of the investigation. At 21 days after flowering (DAF) at which water requirement is high in soybean, the hyperspectral reflection was lower than that of weeds, and at 42 DAF, the hyperspectral reflection of weeds was lower than that of soybeans. The carotenoid indicators (CI), known to be related to water stress in plants, was higher than that of weeds at 21 DAF, and at the higher weed density, weeds are higher than soybeans, and it is estimated that the more weeds occur, the more weeds are superior to soybeans in competition for water. When comparing the pigment specific simple ratio (carotenoids) (PSSRc) related to carotenoid level by the weed densities, the index of soybean at the low weed density and medium density decreased at 42 DAF compared to the value at 21 DAF.

Keyword


서 언

콩(Glycine max [L.] Merr.)은 우리나라의 대표적인 밭작물로써, 원산지는 동북아시아 지역으로 일본, 중국을 비롯하여 우리나라에서 재배되고 있다. 콩은 파종시기가 빠르고 생육기간이 길어 잡초와의 경합 기간도 길며, 인력에 의한 잡초방제도 매우 어렵다(Jong and Kim, 1978). 잡초에 의한 피해는 병충해와 더불어 수량을 크게 감소시키는 요인이며, 그 가운데 잡초와의 경합이 작물 생산성을 크게 떨어뜨린다고 하였다(Lee and Lee, 2009; Shin and Kim, 1983). 콩밭에서 잡초에 의한 피해는 발생 잡초에 따라 다르나 심할 경우 90% 이상의 콩 수량 감소를 나타내기도 한다(Jang and Kuk, 2020; Jang et al., 2019; Song et al., 2010). 잡초 피해의 여러 요인들 중 수량 감소에 영향을 주는 요인은 잡초발생밀도다(Jordan et al., 1987). 따라서 잡초에 의한 작물 수량 감소를 줄이기 위해서는 작물 출현 전 혹은 후에 잡초를 빨리 제거해야 되며 콩 수량의 감소를 방지하기 위해서 파종 후 3-4주 이내 잡초를 방제해야 된다고 하였다(Rajcan and Swanton, 2001; Shin and Kim, 1983).

세계적으로 작물 생산량은 잡초로 인하여 약 9% 정도 감소한다(Neve et al., 2018). 이러한 잡초 문제 해결을 위해 잡초의 발생을 확인하기 위한 여러 기술이 개발되었다. 이중 proximal and remote sensing techniques은 주로 정밀농업에서 잡초 방제를 위한 작물과 잡초 식별을 위해 이용되는 기술이다(Behmann et al., 2015; Wang et al., 2019). 초분광 분석은 식물체 조직을 손상 없이 분석하는 비파괴적 분석으로 식물의 영상 데이터에 기반하여 다양한 특성을 빠르게 분석 가능하며, 농업에서도 활용 가능성이 점차적으로 높아지고 있다.

초분광 센싱 기술은 작물 영상 데이터에 기반하여 적용할 수 있는 적합한 방법으로 작물과 잡초의 초분광 반사율의 특징을 다양한 환경 조건에서 상업적으로 이용할 수 있도록 적용하는 것이 필요하다(Westwood et al., 2018). 세계적으로 스펙트럼 촬영기기의 발달이 이루어지면서 원격센서를 사용하여 잡초 경합에 따른 스트레스 및 그에 따른 작물과 잡초의 분광데이터를 수집하여 활용되고 있지만, 현재 우리나라에서 작물과 잡초 연구는 잡초 구별에 초점을 맞추고 있다. 하지만 잡초와 작물의 경합에 있어서 잡초 발생에 따른 작물의 반응에 대한 초분광 분석 기술을 활용한 연구는 부족하다. 소나무 경우, 강한 경합에서 생장한 잎의 가시광선 반사율을 약한 경합에서 생장한 잎의 가시광선 반사율과 비교했을 때, 약한 경합에 의해 생장한 잎의 가시광선 반사율이 높았으며(Carter et al., 1989), 지상부와 지하부 Fraxinus mandshurica 잎들을 400 nm부터 900 nm까지 스펙트럼을 분석한 결과, 높은 색소 함량 때문에 500 nm부터 700 nm까지 반사율은 낮은 것으로 나타났다(Liu et al., 2012). 따라서 스펙트럼 반응은 경합으로 야기된 스트레스에서 좋은 지표이며, 초분광 측정은 경합과 관련된 반응을 선별하기에 잠재성이 높은 방법으로 사료된다. 하지만 경합과 같은 복잡한 과정에서 이용할 수 있는 스펙트럼 반응 범위를 이해하는 것이 부족하며, 환경 및 경합과 관련된 종들에 의한 스펙트럼 변화도 거의 알지 못한다. 따라서 작물과 잡초 종들의 경합을 이해할 수 있는 스펙트럼 변화 및 반응에 초점을 둔 연구가 필요하다(Liu et al., 2012). 작물의 수량 감소를 일으키는 잡초 경합은 양·수분 및 광에 대한 작물의 이용을 낮추어 발생한다(Rajcan and Swanton, 2001). 본 연구는 잡초와 작물간 경합에서 나타나는 작물의 변화를 알아보기 위해 초분광 분석에서 얻어진 영상 데이터에서 추출한 식생지수들을 분석하고, 향후 콩 밭에서 잡초 관리 기초 자료로써 활용하고자 수행하였다.

재료 및 방법

재배방법

본 연구는 경상남도 진주시 가좌동에 위치한 경상국립대학교 부속농장 전작포장에서 수행되었다. 시험 품종은 국내에서 육성된 선풍콩을 이용하였으며, 파종 전 경운 및 기비 처리 후, 2021년 7월 14일에 재식거리 60 cm×20 cm로 1주 2본으로 파종하였다. 시비량은 10 a 당 N-P2O5-K2O를 성분량 기준 3.0-3.0-3.4을 전량 기비로 시용하였다. 파종 후 잡초 발생 밀도 조절을 위해 알라클로르 입제를 0.5-2 kg 10 a-1 살포하였으며, 이후 제초제는 처리하지 않았다. 기타 재배관리는 농촌진흥청 콩 표준 재배법에 준하였다.

콩과 잡초 경합에 따른 포장 조사

잡초발생밀도 수준을 파종전 처리 제초제의 사용량 조절과 발생 후 손제초를 통해 잡초 밀도는 저밀도, 중밀도, 고밀도 처리로 총잡초수 기준 50, 200, 350본 m-2으로 조절하였다. 개화일인 2021년 8월 26일을 기준으로 개화 21일 후와 42일 후에 해당하는 2021년 9월 15일과 2021년 10월 05일에 각각 콩 식물체와 잡초의 건물중을 조사하였으며, 2021년 11월 05일에 콩을 수확 후 수량을 조사하였다.

콩과 잡초의 분광학적 특성 분석

잡초발생밀도 수준에 따른 콩과 잡초의 초분광 반사 특성을 알아보기 위하여 지상부 생장이 최고점에 도달한 입비대시(R5)에 해당하는 2021년 9월 15일에 초분광카메라(Specsim IQ, Specim Ltd., Oulu, Finland)를 이용하여 초분광 영상을 촬영하였다. 초분광 영상은 완전 전개된 최상위엽을 대상으로 엽표면 위 150 cm 높이에서 촬영하였다. 초분광 영상의 ROI (region of interest)는 콩의 경우 최상위 엽으로 하였고 잡초는 150 cm 높이 영상에 들어온 모든 잡초의 최상위 엽으로 하였다. 촬영 시 지표와 평행하게 카메라를 위치하였고, 광원은 구름 없는 맑은 시간에 태양광을 이용하였다. 초분광 영상 촬영시 영상 보정을 위해 99% barium sulfate로 표면 코팅된 reference plate를 이용하였다. 촬영한 이미지는 ENVI 프로그램을 이용하여 가시광선부터 적외선까지 파장 반사값을 추출하여 식생지수를 분석하였다. 다양한 식생지수는 특정 파장의 반사율에 근거하여 Table 1의 계산식에 근거하여 구하였다.

Table 1. Spectral indices used in this study.

http://dam.zipot.com:8080/sites/WTS/images/N0260110302_image/Table_WTS_11_03_02_T1.jpg

R is the reflectance value at a given wavelength.

결과 및 고찰

콩과 잡초의 생육 분석

콩은 개화 초기부터 종자형성초기까지 잡초 경합해를 가장 심하게 받는다고 한다(Acker et al., 1993). 개화기 이후에 조사한 본 연구에서 잡초발생밀도가 높을수록 콩의 건물중은 낮았다. 즉, 개화 후 21일차 잡초 건물중이 18, 45, 132 g·m-2 증가할수록 콩의 건물중은 457, 333, 270 g·m-2 순으로 감소하였다. 개화 후 42일차에서도 잡초발생밀도 저, 중, 고의 잡초 건물중은 14, 35, 56 g·m-2이었고 콩의 건물중은 853, 733, 503 g·m-2으로 잡초 건물중 증가에 따라 콩 건물중의 감소가 일어났다(Fig. 1). 개화 후 21일과 42일을 비교해보면, 잡초발생 고밀도구에서 잡초 건물중의 감소 폭이 잡초발생 저밀도구에 비해 높은 것으로 보아, 잡초발생밀도가 높아짐에 따라 잡초종들간 경합과 잡초와 작물간 경합이 커져서 잡초 건물중의 감소가 잡초 고밀도구에서 커진 것으로 보인다. 또한 잡초 저밀도구에서 콩의 생장 역시 왕성하여 저밀도 잡초발생구에서 초관형성기 이후의 콩에 의한 잡초생장 억제가 잡초 고밀도구에서 보다 강하게 나타난 것으로 보인다.

잡초발생밀도에 따른 콩 수량조사한 결과(Fig. 2), 잡초 고밀도구의 콩 수량은 잡초발생 저밀도구에 비해 21% 감소한 것으로 확인되었다. Kim and Kim (1984)은 콩밭에서 바랭이, 쇠비름, 좀명아주, 깨풀 등이 평방미터당 209 개체가 발생할 때 콩 수량은 약 80%까지 감소한다고 하였고, Yoo et al. (2012)은 깨풀의 밀도가 높아질수록 완전방제구 대비 11-51%의 수량 감소를 보였다는 결과를 고려할 때 본 연구에서 수량 감소는 비교적 작게 나타났다.

잡초발생밀도에 따른 잡초종의 건물중을 조사한 결과(Fig. 3), 콩 밭에서 조사된 잡초종들은 쇠비름, 참방동사니, 한련초, 석류풀, 별꽃아재비, 깨풀, 털비름이었고(Table 2), 잡초발생밀도가 낮은 구보다 잡초발생밀도가 높은 구에서 다양한 잡초종이 발생하였다. 한편 개화 후 21일보다 42일에 전체 건물중은 낮았으나, 잡초종들 가운데 깨풀의 건물중은 점차 높아졌으며, 한련초의 경우는 잡초발생밀도가 낮은 구역을 제외하고는 높은 것으로 나타났다. 또한 기타 잡초들의 건물중은 잡초발생 고밀도구에서만 감소하였다.

깨풀은 일년생 초본으로 봄에 발생하여 여름에도 발생이 왕성한 잡초종이며 콩밭에서 발생이 많고 콩의 전생육기간 걸쳐 발생한다. Chang et al. (1990)와 농촌진흥청(RDA, 2005)에 의하면 경남 지역 콩밭 에서 바랭이, 쇠비름, 방동사니와 더불어 발생이 많은 잡초종이라 하였고, 본 연구에서도 깨풀이 콩밭의 우점 잡초종인 것으로 확인된다.

http://dam.zipot.com:8080/sites/WTS/images/N0260110302_image/Fig_WTS_11_03_02_F1.png

Fig. 1. Dry weight of total weeds and soybean plants according to the weed density in the soybean field (A: 21 days after flowering [DAF], B: 42 DAF).

http://dam.zipot.com:8080/sites/WTS/images/N0260110302_image/Fig_WTS_11_03_02_F2.png

Fig. 2. Soybean yield according to the weed density in the experimental field.

http://dam.zipot.com:8080/sites/WTS/images/N0260110302_image/Fig_WTS_11_03_02_F3.png

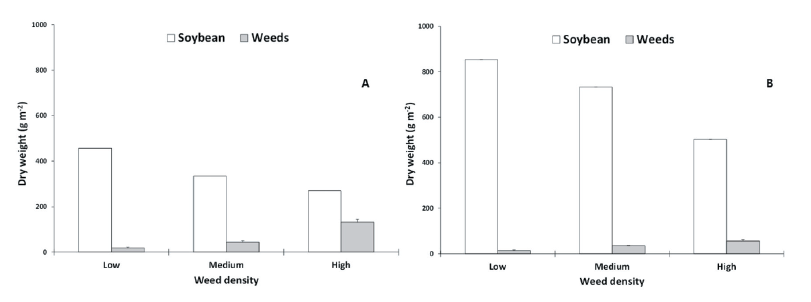
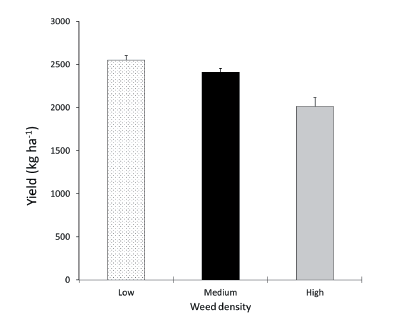
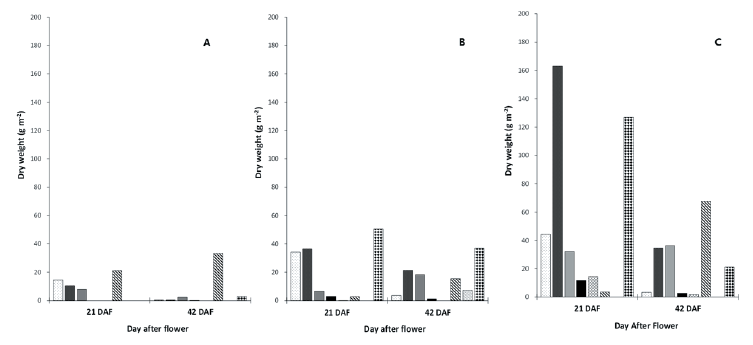
Fig. 3. Dry weight of weed species according to the weed density in the soybean field (A: Low weed density; B: Medium weed density; C: High weed density; : Portulaca oleracea ; : Cyperus iria ; : Eclipta rostrata ; : Mollugo entaphylla ; : Galinsoga parviflora ; : Acalypha australis ; : Amaranthus retroflexus ; :Others).

Table 2. Weeds species occurred in the soybean field.

http://dam.zipot.com:8080/sites/WTS/images/N0260110302_image/Table_WTS_11_03_02_T2.jpg

초분광 분석에 의한 식생지수

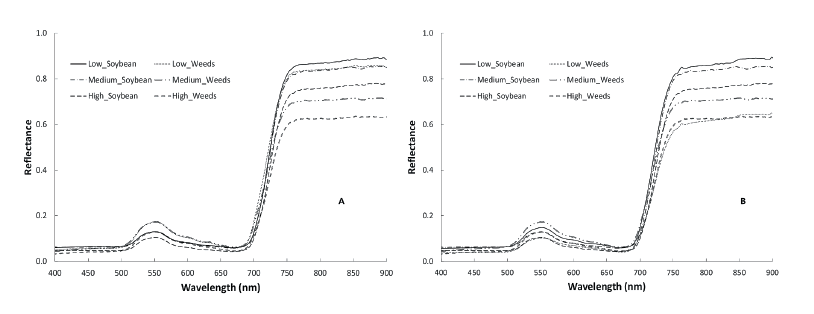
잡초발생밀도에 의한 콩과 잡초의 초분광 반사 특성은 가시광선 영역 중 청색대(400-490 nm)과 녹색대(530-570 nm), 적색대(630-680 nm), 근적외선 영역대(680-900 nm)에서 잡초 및 조사 시기에 따라 차이를 보였다(Fig. 4). 식물체내수분함량이 감소하면 전체적으로 초분광 반사율이 변화하는데, 본 연구에서도 개화 21일차에선 콩의 반사율이 낮았고, 개화 42일차에는 잡초 반사율이 낮았다. 이는 콩과 잡조종들의 생육 기간이 달라 콩은 성숙함에 따라 수분 함량이 낮아지는데 반해 이 시기에 깨풀 등과 같은 잡초는 수분 함량이 유지되어 나타난 결과로 생각된다(Fig. 4). 초분광 카메라를 이용하여 콩과 잡초의 반사율에 기반한 식생지수로 산출한 결과(Table 3 and 4), 잡초발생 중간밀도구에서 콩과 잡초의 CI (carotenoid indices) 모두 다른 밀도구에 비해 높은 값을 보였으며, 잡초보다 콩에서 높은 값을 보였다. CI는 식물의 수분스트레스와 관련이 있다고 알려져 있는데(Zarco-Tejada et al., 2012), 본 연구에서 콩이 잡초보다 높은 값을 보인 것은 콩은 개화 후 21일이 지나면서 성숙에 접어들어 수분 함량이 낮아지기 때문에 CI 값이 높은 반면 잡초종들은 종별 생육 단계가 다르고, 깨풀의 경우에서 볼 수 있는 것처럼 개화 후 42일차에도 수분 흡수와 증산 등 활발한 생리 작용을 하고 있기 떄문에 낮은 CI 값을 나타낸 것으로 생각된다(Fig. 2). 그리고 잡초 중간밀도구의 잡초종들 가운데 한련초, 깨풀, 털비름이 개화 후 42일에도 전체 건물중이 높아진 것으로 보아(Fig. 2), 이 시기까지 활발한 생장을 하고 있으며 수분경쟁에 있어서도 작물과 경합력이 큰 것으로 판단된다. Ronay et al. (2021)에 의하면 작물의 LWI (leaf water index)도 잡초 무처리구보다 잡초 발생구에서 낮았으며, 일정 정도 시간이 경과한 뒤 잡초와 수분 경쟁에서 유의한 차이를 보였다고 한다.

RI (redness index)는 엽의 질소상태를 알 수 있는 식생지수이다(Shin and Kim, 1983). 개화 후 21일에 잡초발생 저밀도구와 중밀도구의 콩 RI는 잡초의 RI보다 높았지만, 개화 후 42일에는 그와 반대의 결과를 보였다. 반면 잡초발생 고밀도구의 콩 RI는 잡초의 RI보다 높았지만, 개화 후 42일에는 반대의 결과를 보였다. 이러한 결과는 잡초발생밀도에 따라서 잡초와 콩의 양분 이용에 있어서 차이가 일어나는 것으로 사료된다(Table 3 and 4). 더불어 질소 스트레스 지수로써 RhRi (the physiological reflectance index)는 잡초발생밀도 및 조사 시기마다 콩은 0의 값을 보였으나, 잡초의 경우 개화 후 21일에는 잡초발생 고밀도구에서 높았고, 개화 후 42일에는 잡초발생 저밀도구에서 높은 것으로 보아, 질소 영양 관련 스트레스가 콩보다 잡초에서 높은 것으로 사료된다(Gamon et al., 1992). RE-NDVI는 식물 내부구조, 노화 등의 변화에 민감한 red-edge 반사율을 사용한 지수로 작물의 건강한 상태를 알 수가 있다(Jordan et al., 1987). 개화 후 21일 잡초 중밀도구와 저밀도구는 콩 RE-NDVI가 잡초 RE-NDVI보다 높았지만, 잡초 고밀도구는 콩 RE-NDVI가 잡초 RE-NDVI 보다 높았다. 개화 후 42일는 개화 후 21일보다 RE-NDVI가 낮았으며, 특히 잡초 고밀도구의 콩과 잡초가 각각 0.12, 0.094으로 다른 밀도구의 콩과 잡초 보다 높은 폭으로 감소하였다(Table 3 and 4). 이는 잡초 고밀도구에서 작물의 생육이 급격하게 낮아졌기 때문으로 생각된다. 카로티노이드 수준과 관련있는 PSSRc (pigment specific simple ratio [carotenoids])지수의 경우 잡초생 저밀도구에서 개화 후 21일과 개화 후 42일에 콩의 PSSRc만 증가하였다. 반면 다른 잡초 밀도구에서 콩과 잡초의 PSSRc는 감소하였고, 특히 잡초 고밀도구 콩의 PSSRc가 3.828으로 가장 높은 폭으로 감소하였다. 이는 콩의 성숙에 따른 엽 노화가 잡초발생 고밀도구에서 빨랐기 때문이며 또한 잡초발생 고밀도 콩 PSSRc 감소 폭이 잡초 PSSRc 감소폭보다 높은 것으로 보아 작물과 잡초의 수분 경쟁에 따른 산화스트레스로 인한 항산화 능력과 밀접한 관련이 있는 카로티노이드 때문에 PSSRc 차이가 나타난 것으로 보인다.

카로티노이드와 엽록소 비율 및 광이용효율과 관련이 있는 PRI (photochemical reflectance index), PSRI (plant senescence reflectance index), SIRI (structure independent pigment index) 지수들도 차이를 보였다. PRI는 개화 후 21일보다 개화 후 42일에서 낮았으며, 특히 잡초 발생 중밀도구 콩과 잡초가 다른 밀도구보다 낮았다. 콩의 PSRI는 개화 후 21과 개화 후 42일 잡초발생 저밀도구와 중밀도구에서 약간 증가하거나 유지되는 값을 보였으나, 잡초 발생 고밀도구에서는 감소한 것으로 확인되었다. 잡초의 PSRI는 개화 후 42일 잡초발생 고밀도에서 증가하였다. SIPI는 개화 후 21일보다 개화 후 42일에서 증가한 것으로 확인되었고 증가 폭은 잡초발생 고밀도구가 높았다(Table 3 and 4). Osakabe et al. (2014)와 Na et al. (2019)은 다양한 스트레스 조건에서 광합성 효율이 낮아지면 크산토필 회로 및 카로틴이 방어 기작으로 작동하기 때문이라고 하였다. 본 연구에서도 잡초발생 밀도 차이에 따른 환경 스트레스로 잡초발생 고밀도구에서 광합성 효율이 점차적으로 낮아졌는데, 이는 잡초 고밀도구에서 작물의 노화 및 엽록체 구조 변화가 크게 일어나 높아진 것으로 사료된다. 엽록체 및 엽록소 함량과 관련된 식생지수(PSSRa [pigment specific simple ratio (cholophyll a)] PSSRb [pigment specific simple ratio (cholophyll a)])는 개화 후 21일에 잡초발생 고밀도구의 콩이 가장 높았지만, 개화 후 42일에는 잡초발생 고밀도구의 콩이 가장 낮았다. 이러한 결과는 콩과 잡초의 상대적 밀도가 작물과 잡초들의 생장에 영향을 주었으며 작물의 생육 단계에서도 영향을 주었다고 판단된다. Ronay et al. (2021)도 옥수수에서 잡초발생구의 건물중이 무잡초구의 건물중보다 낮았으며 식생지수도 잡초의 발생량과 생육단계에 따라 차이를 보인다고 하였다. 본 연구에서도 잡초 건물중이 개화 후 21일보다 개화 후 42일에서 낮았고(Fig. 3), 잡초발생밀도에 따라서 식생지수 감소 폭이 저밀도구보다 고밀도구에서 높았으며 이는 잡초 건물중 변화 결과와 일치하였다(Table 3; Fig. 3).

NDVI: Normalized difference vegetation index - (R800-R680)/(R800+R680); Re-NDVI: Normalized difference 750/710 red edge NDVI - (R750-R710)/(R750+R710); MRE NDVI: Modified normalized difference 705 - (R750-R705)/ (R750+R705-2×R445); NRI: Nitrogen reflectance index - (R570-R670)/(R570+R670); GI: Greenness index - R570/ R670; SRI: Simple ratio - R900/R680; GNDVI: Green normalized difference vegetation index - (R750-R550)/ (R750+R550); VOG REI 1: Vogelmann index - R740/R720; PRI: Photochemical reflectance index - (R531-R570)/ (R531+R570); PSRI: Plant senescence reflectance index - (R680-R500)/R750; SIPI: Structural independent pigment index - (R800-R445)/(R800+R680); BI: Blue index - R450/R490; PSSRa: Pigment specific simple ratio (cholophyll a) - R800/R680; PSSRb: Pigment specific simple ratio (cholophyll b) - R800/R635; PSSRc: Pigment specific simple ratio (carotenoids) - R800/R500; CI: Simple ratio 515/570 - R515/R570; RI: Redness index - R700/R670; PhRi: Physiological reflectance index - (R550-R531)/(R550+R531); GCI: Green chlorophyll index - (R780/R550)-1.

Table 2. Weeds species occurred in the soybean field.

http://dam.zipot.com:8080/sites/WTS/images/N0260110302_image/Table_WTS_11_03_02_T3.jpg

NDVI: Normalized difference vegetation index - (R800-R680)/(R800+R680); Re-NDVI: Normalized difference 750/710 red edge NDVI - (R750-R710)/(R750+R710); MRE NDVI: Modified normalized difference 705 - (R750-R705)/ (R750+R705-2×R445); NRI: Nitrogen reflectance index - (R570-R670)/(R570+R670); GI: Greenness index - R570/ R670; SRI: Simple ratio - R900/R680; GNDVI: Green normalized difference vegetation index - (R750-R550)/ (R750+R550); VOG REI 1: Vogelmann index - R740/R720; PRI: Photochemical reflectance index - (R531-R570)/ (R531+R570); PSRI: Plant senescence reflectance index - (R680-R500)/R750; SIPI: Structural independent pigment index - (R800-R445)/(R800+R680); BI: Blue index - R450/R490; PSSRa: Pigment specific simple ratio (cholophyll a) - R800/R680; PSSRb: Pigment specific simple ratio (cholophyll b) - R800/R635; PSSRc: Pigment specific simple ratio (carotenoids) - R800/R500; CI: Simple ratio 515/570 - R515/R570; RI: Redness index - R700/R670; PhRi: Physiological reflectance index - (R550-R531)/(R550+R531); GCI: Green chlorophyll index - (R780/R550)-1.

Table 4. Vegetative indices of both soybean and weeds at 42 days after flowering.

http://dam.zipot.com:8080/sites/WTS/images/N0260110302_image/Table_WTS_11_03_02_T4.jpg
http://dam.zipot.com:8080/sites/WTS/images/N0260110302_image/Fig_WTS_11_03_02_F4.png

Fig. 4. Hyperspectral reflectances of weeds and soybean plants in the soybean field according to the weed density (A: 21 days after flowering [DAF], B: 42 DAF).

Acknowledgements

This study was a part of the research funded by the Korean Ministry of Environment (grant no.: 2021002270004).

Authors Information

Hye-Rin Hwang, Gyeongsag National University, Master student

Jae-Gyeong Jung, National Institute of Forest Science, Researcher

Se-Sil Hong, Gyeongsag National University, Master student

Ki-Eun Song, Gyeongsag National University, Ph.D. student

Sun-Hee Hong, Hankyong National University, Professor

Sang-In Shim, https://orcid.org/0000-0003-1009-3581

References

1 Acker, R.C.V., Swanton, C.J. and Weise, S.F. 1993. The critical period of weed control in soybean Glycine max L. Merr. Weed Sci. 41:194-200.  

2 Behmann, J., Mahlein, A.K., Rumpf, T., Römer, C. and Plümer, L.A. 2015. A review of advanced machine learning methods for the detection of biotic stress in precision crop protection. Precis. Agric. 16:239-260.  

3 Blackburn, G.A. 1998. Spectral indices for estimating photosynthetic pigment concentrations: A test using senescent tree leaves. Int. J. Remote Sens. 19:657-675.  

4 Calderón, R., Navas-Cortés, J.A., Lucena, C. and Zarco-Tejada, P.J. 2013 High-resolution airborne hyperspectral and thermal imagery for early detection of Verticillium wilt of olive using fluorescence, narrow-band spectral indices. Remote Sens. Environ. 139:231-245.  

5 Carter, G.A., Paliwal, K., Pathre, U., Green, T.H., Mitchell, R.J., et al. 1989. Effect of competition and leaf age on visible and infrared reflectance in pine foliage. Plant Cell Environ. 12:309-315.  

6 Chang, Y.H., Kim, C.S. and Youn, K.B. 1990. Weed occurrence in upland crop fields of Korea. Korean J. Weed Sci. 10:294-304. (In Korean)  

7 Chen, J.M. 1996. Evaluation of vegetation indices and a modified simple ratio for boreal applications. Can. J. Remote. Sens. 22:229-242.  

8 Gamon, J.A., Peñuelas, J. and Field, C.B. 1992. A narrow-waveband spectral index that tracks diurnal changes in photosynthetic efficiency. Remote. Sens. Environ. 41:35-44.  

9 Gitelson, A. and Merzlyak, M.N. 1994. Spectral reflectance changes associated with autumn senescence of Aesculus hippocastanum L. and Acer platanoides L. leaves. spectral features and relation to chlorophyll estimation. J. Plant. Physiol. 143:286-292.  

10 Huang, W., Yang, Q., Pu, R. and Yang, S. 2014. Non-destructive optical detection of pigment changes during leaf senescence and fruit ripening. Physiol. Plant. 106:135-141.  

11 Merzlyak, M.N., Gitelson, A.A., Chivkunova, O.B. and Rakitin, V.Y. 1999. Non-destructive optical detection of pigment changes during leaf senescence and fruit ripening. Physiol. Plant. 106:135-141.  

12 Jang, S.J., Lee, D.J. and Kuk, Y.I. 2019. Soybean growth and yield reductions caused by Quamoclit coccinea at varying density. Res. on Crops. 20:301-305.  

13 Jang, S.J. and Kuk, Y.I. 2020. Occurrence distribution of an exotic plant Ipomoea hederacea and soybean growth and yield reductions caused by its occurrence densities. Res. on Crops. 20:76-81.  

14 Jong, Y.P. and Kim, Y.R. 1978. Competitive effects of annual weeds on soybeans I. Effect of weed competition time on the growth and yield of soybeans. J. Korean Soc. Crop Sci. 23:86-89. (In Korean)  

15 Jordan, T.N., Coble, H.D. and Wax, L.M. 1987. Weed control. pp. 429-460. In: Wilcox, J.R. (Eds.) Soybean: Improvement, production, and uses. American Society of Agronomy, Inc., Madison, WI, USA.  

16 Kim, T.I. and Kim, K.U. 1984. Effect of different herbicides and planting density on weed control and soybean yield. Research Report 1:21-30. Institute of Agricultural Sci. Tech., Kyungpook National University, Daegu, Korea. (In Korean)  

17 Lee, K.H. and Lee, E.W. 2009. Studies on the occurrence of upland weeds and the competition with soybeans. Kor. J. weed Sci. 29:323~327. (In Korean)  

18 Lemaire, G., Oosterom, E.V., Sheehy, J., Jeuffroy, M.H., Massingnamm, A., et al., 2007. Is crop N demand more closely related to dry matter accumulation or leaf area expansion during vegetative? Field Crops Res.100:91-106.  

19 Liu, W., Fan, X., Wang, J., Zhang, C., Lu, W., et al. 2012. Spectral reflectance response of Fraxinus mandshurica leaves to above-and belowground competition. Int. J. Remote Sens. 33:5072-5086.  

20 Na, S.l., Park, C.W., So, K.H., Ahn, H.Y. and Lee, K.D. 2019. Photochemical reflectance index (PRI) mapping using drone-based hyperspectral image for evaluation of crop stress. and its application to multispectral imagery. Korean J. Remote Sens. 35:637-647. (In Korean)  

21 Neve, P., Barney, J.N., Buckley, Y., Cousens, R.D., Graham, S., et al. 2018. Reviewing research priorities in weed ecology, evolution and management: A horizon scan. Weed Res. 58:250-258.  

22 Osakabe, Y., Osakabe, K., Shinozaki, K. and Tran, L.S.P. 2014. Response of plants to water stress. Front. Plant Sci. 5:86.  

23 Peñuelas, J., Baret, F. and Filella, I. 1995. Semi-empirical indices to assess carotenoids/chlorophyll a ratio from leaf spectral reflectance. Photosynthetica. 31:221-230.  

24 Peñuelas, J., Gamon, J.A., Griffin, K.L. and Field, C.B. 1993. Assessing community type, plant biomass, pigment composition, and photosynthetic efficiency of aquatic vegetation from spectral reflectance. Remote Sens. Environ. 46:110-118.  

25 Rajcan, I. and Swanton, C.J. 2001. Understanding maize-weed competition: Resource competition, light quality and the whole plant. Field Crops Res. 71:139-150.  

26 RDA (Rural Development Administration). 2005. Weed precision survey in crop fields of Korea. pp. 63-194. RDA, Suwon, Korea. (In Korean)  

27 Ronay, I., Ephrath, J.E., Eizenberg, H., Blumberg, D.G. and Maman, S. 2021. Hyperspectral reflectance and indices for characterizing the dynamics of crop–weed competition for water. Remote Sens. 13:513.  

28 Sims, D.A. and Gamon, J.A. 2002. Relationships between leaf pigment content and spectral reflectance across a wide range of species, leaf structures and developmental stages. Remote Sens. Environ. 81:337-354.  

29 Shin, D.H. and Kim, K.U. 1983. Ecological characteristics of Digitaria sanguinalis in temperate climate. Kor. J. weed Sci. 3:29-38.  

30 Song, S.B., Lee, J.S., Kang, J.R., Ko, J.Y., Seo, M.C., et al. 2010. The growth and yield of soybean as affected by competitive density of Cuscuta pentagona. Kor. J. Weed Sci. 30:390-395. (In Korean)  

31 Vogelmann, J.E., Rock, B.N. and Moss, D.M. 1993. Red edge spectral measurements from sugar maple leaves. Int. J. Remote Sens. 14:1563-1575.  

32 Wang, A., Zhang, W. and Wei, X. 2019. A review on weed detection using ground-based machine vision and image processing techniques. Comput. Electron. Agric.158:226-240.  

33 Westwood, J.H., Charudattan, R., Duke, S.O., Fennimore, S.A., Marrone, P., et al. 2018. Weed management in 2050: Perspectives on the future of weed science. Weed Sci. 66:275-285.  

34 Wu, C., Han, X., Ni, J., Niu, Z. and Huang, W. 2010. Estimation of gross primary production in wheat from in situ measurements. Int. J. Appl. Earth Obs. Geoinf. 12:183-189.  

35 Yoo, J.H., Moon, B.C., Lee, I.Y. and Kim, D.H. 2012. Effect of Acalypha australis occurrence on soybean growth and economic threshold level of Acalypha australis. Weed Turf. Sci. 1:13-17. (In Korean)  

36 Zarco-Tejada, P.J., González-Dugo, V. and Berni, J.A. 2012. Fluorescence, temperature and narrow-band indices acquired from a UAV platform for water stress detection using a micro-hyperspectral imager and a thermal camera. Remote. Sens. Environ. 117:322-337.  

37 Zhang, F. and Zhou, G. 2019. Estimation of vegetation water content using hyperspectral vegetation indices: A comparison of crop water indicators in response to water stress treatments for summer maize. BMC Ecol. 19:1-12.