Hyperspectral Image Analysis for Wear Stress Diagnosing of Zoysiagrass

Research Article
정 재경  Jae-Gyeong Jung1윤 준혁  Jun-Hyuck Yoon1진 언주  Eon-Ju Jin1전 권석  Kwon-Seok Jeon1김 영선  Young-Sun Kim2,3배 은지  Eun-Ji Bae 1*

Abstract

The objective of this study was to diagnose the wear stress of zoysiagrass (Zoysia spp.) based on visible/near-infrared (VIS/NIR) hyperspectral image and vegetation index. As a result of comparing the reflectance measured from the leaves, both zoysiagrasses (Zoysia japonica and Z. matrella) showed a slight increase in reflectance at 550 nm after the wear stress, that the greenness decreased after wear stress. Considering that the reflectance of 600~700 nm, which is the red wavelength band was greatly increased, it was found that leaf chlorosis and leaf aging occurred in both zoysiagrasses due to wear stress. The NIR reflectance decreased overall, indicating that the occurrence of stress caused by the wear can be diagnosed. When comparing the vegetation index before and after wear stress, the normalized difference vegetation index (NDVI) and RENDVI (Red edge NDVI) of Z. japonica decreased by 36.5% and 43.0%, and NDVI and RENDVI decreased by 35.3% and 37.9% of Z. matrella. Also, through the evaluation of vegetation images through NDVI, it was found that the turfgrass health was significantly reduced before and after wear condition. EVI decreased by 33.4% in Z. japonica and 46.1% in Z. matrella, which was effective in Z. matrella. PSSRa, b, c decreased by 63.0%, 56.9%, and 45.6% in Z. japonica and by 65.7%, 58.9%, and 39.5% in Z. matrella. With this hyperspectral analysis, it was possible to confirm the change in reflectivity that varies depending on the wear conditions between Z. japonica and Z. matrella, and it was confirmed that the damage and stress of the wear could be quantified through the vegetation index.

Keyword


서 언

한국잔디는 내환경성이 우수하지만 학교 운동장과 같이 답압이 지속적이고 장기적으로 누적되는 특수한 조건에서는 잔디의 생육이 불량해지고, 토양의 이화학성이 변한다(Han et al., 2015). 특히 학교 운동장은 골프장, 경기장과 달리 학생들의 건강을 위해 화학농약 사용이 제한적이며, 관리 인력 및 예산이 적어 충분한 관리를 받지 못하고 있다(Chang et al., 2020; Chang et al., 2022). 또한 천연잔디 학교 운동장은 사용 인원, 사용 빈도, 운동량에 많은 영향을 받기 때문에 학생수가 많고 운동장 활용 빈도가 높을 경우 심한 답압과 마모로 인한 생장점 손상으로 잔디의 생장 및, 피복 밀도 유지에 어려움이 커진다(Lee and Lee, 2021; Han et al., 2015). 이를 해결하기 위해서는 기본적인 잔디관리 수준을 높이고, 잔디 보식, 통기, 배토 등과 같은 갱신작업을 통하여 양질의 잔디 생육이 유지될 수 있는 잔디관리가 되어야 하며(Han et al., 2015), 답압, 마모, 건조 등 환경 적응성이 우수한 학교운동장용 잔디 품종 개발이 필요하다.

환경 스트레스 저항성이 높고, 고품질의 잔디 품종을 개발하기 위해서는 생육 기간 중 잔디의 환경스트레스 반응을 상시적이고 객관적으로 평가하고 그 결과를 바탕으로 잔디 품종을 육성할 수 있는 기술 구축이 필요하다. 학교운동장에 활용하기 위해 답압과 마모에 강한 한국잔디를 평가하고자 답압 처리에 따른 지상부 마모 스트레스 정도를 지질막 구성물질의 산화 정도를 통해 정량적으로 나타낼 수 있는 MDA (malondialdehyde) 함량 분석을 실시하였다. 하지만 측정을 위해서는 샘플을 채취해야 하며, 현장에서 즉각적인 확인이 제한되는 단점이 있다(Bae et al., 2012; Bae et al., 2021). 또한 엽록소 함량 측정(Wintermans and De mots, 1965; Ritchie, 2008), 조단백질 함량 분석(Kjeldahl, 1883; Muñoz-Huerta et al., 2013; Mæhre et al., 2018) 등과 같은 기존 재래적 방법은 파괴적이고, 실험실과 전문적인 인력을 필요로 한다. 이러한 단점을 해소하고자 비파괴적으로 작물의 상태를 신속하게 진단할 수 있는 NDVI, SPAD, Multispectral camera와 같은 여러 휴대용 기기와 분석기술이 개발되었다(Hlavinka et al., 2013; Zhang et al., 2018). 또한 LANDSAT 위성에 분광 기기가 탑재되면서부터 국가에서 조사한 대면적의 데이터 접근이 가능해져 미국 중부 식생 조사(Rouse et al., 1973), 피복 식생 분류(Clack, 2017), 광물 원격탐사(Sabins, 1999) 등 다양한 연구분야가 수행되고, 분광기술이 본격적으로 발달하였다. 특히 초분광 카메라는 정밀하면서도 빠르게 작물의 상태를 진단할 수 있는 기기로 다른 여러 휴대용 기기보다 많은 장점을 지니고 있다. 초분광 데이터의 활용성이 커지면서 기기의 소형화 및 비용 절감을 통해 드론에 탑재되거나 포터블로 사용할 수 있는 기기가 출시되는 등 시장 규모가 커지고 접근성이 좋아지고 있다. 농업에 초분광을 적용한 연구가 2001년~2010년 97건에서 2011년~2020년 245건으로 약 2.5배 증가했다는 보고(Lu et al., 2020)를 통해 연구자들이 초분광 기술을 적용하기 용이해졌음을 확인할 수 있었다. 초분광카메라는 엽록소 함량 추정 및 광합성 효율 추정(Zarco-Tejada et al., 2002; Moharana and Dutta, 2016), 수확량 예측(Kanning et al., 2018; Li et al., 2020), 벼의 병 심각성 평가(Liu et al., 2008) 등에 응용되었으며 잔디에서는 양수분 관리 (Badzmierowski et al., 2019) 연구와 잔디 품질 예측 모델 개발 (Askari et al., 2019) 연구들이 수행되었다. 이를 바탕으로 농업 분야에서 초분광 분석의 관심 및 중요성이 커지고 있다.

본 연구는 천연잔디 학교 운동장에 적용할 마모에 강한 한국잔디를 비파괴적으로 평가하기 위해 초분광 카메라를 이용하였으며,마모 처리로 발생하는 스트레스를 초분광 반사율 변화 및 식생지수로 확인하였다. 본 연구를 통해 잔디에서 발생할 수 있는 다양한 생물적, 비생물적 스트레스를 신속히 파악할 수 있는 진단 기술 개발과 관련된 기초자료로 활용하고자 하였다.

재료 및 방법

잔디 식재 및 마모 스트레스 처리

공시초종은 들잔디(Zoysia japonica ‘Zenith’)와 금잔디(Z. matrella)를 이용하였다. 2022년 5월 10일 사각포트(넓이 9 cm×높이 9 cm)에 마사토를 채운 후, 잔디 포복경을 취한 스프리그(포복경 5 cm×6개, 총 30 cm)를 식재하였다. 온도는 최저 22℃와 최고 43℃, 상대습도는 최저 50%와 최고 70% 조건이 유지되는 유리온실에서 2개월간 생육시켰다. 잔디 생육 촉진을 위해 Hoagland 시약(Hoagland's No.2 Basal Salt Mixture, Phytotech labs, Lenexa, KS, US)을 1 L당 1.63 g 녹여 2022년 6월 20일에 화분당 50 mL, 7월 1일과 8일에는 화분당 25 mL씩 관주하였다.

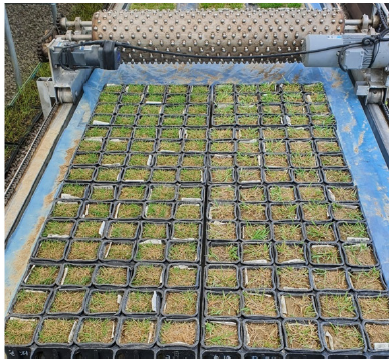
잔디 피복이 70% 이상이 진행된 개체들을 대상으로 마모 스트레스를 처리하였다. 마모 스트레스 기기는 알루미늄 소재로 무게 40 kg, 직경 21.6 cm, 길이 110 cm, 원형돌기를 507개 부착한 기기로 일정한 힘으로 정해진 구획을 왕복하면서 작동하는 방식이다. 마모 스트레스 처리는 2022년 7월 13일부터 28일까지 시간 당 운동에너지 2,400 J, 하루 3시간씩 기기를 구동하였으며, 16일간 누적된 마모 스트레스는 48시간으로 운동에너지는 총 115,200 J 로 강한 답압 수준으로 처리하였다(Fig.1).

http://dam.zipot.com:8080/sites/WTS/images/N0260110408_image/Fig_WTS_11_04_08_F1.png

Fig. 1.A motor-driven equipment used for wear stress treatment in this study.

마모 스트레스에 대한 초분광 영상 측정 및 분광학적 특성 분석

초분광 카메라는 식물로부터 반사된 빛의 양을 측정하는 기기로 파장대 별 반사율을 통해 작물의 생리를 예측할 수 있다. 마모 스트레스에 따라 들잔디와 금잔디에서 달라지는 분광학적 특성을 알아보기 위해 초분광 카메라(Specim IQ, Specim Ltd, Oulu, Finland)를 이용하였다. 카메라 파장범위는 397.3 nm ~ 1,003.6 nm 로 총 204개의 밴드가 측정되었으며, 파장 간격은 약 3 nm이다. 카메라는 지면과 평행하게 위치하여 30 cm높이에서 잔디를 촬영하였다. 광원은 1,000 W 할로겐 전구 두 개를 사용하였다. 100% 반사율을 지니는 99% barium sulfate reference plate를 이용해 촬영된 이미지는 기기 내에서 자동으로 광 보정이 이루어졌다. 촬영한 이미지는 ENVI 5.1 (Exelis Visual Information Solution, Broomfield, CO, US)를 이용해 이미지당 3개의 관심 영역을 지정하여 파장 반사율을 추출하였다. 획득된 초분광 반사율은 Python 3.8.0을 이용해 마모 스트레스의 전후 차이를 비교하고, 식생지수를 추출 하였다

통계처리

초분광 데이터로 얻어진 식생지수는 SAS 프로그램(ver. 9.4 SAS Inst, Cary, North Carolina, US)을 이용하여 Proc ANOVA로 분산분석을 실시하고 Tukey' HSD를 통해 p < 0.05 수준에서 평균값을 비교하였다.

결과 및 고찰

초분광 반사율 변화

가시광선 및 근적외선(visible/near-infrared, VIS/NIR) 영역 중 600~700 nm (적색파장) 와 800 nm 이후(근적외선) 영역은 작물이 스트레스를 받았을 때 민감하게 반응하는 영역이다(Ashourloo et al., 2014). 특히 red-edge는 식물의 엽내 구조에 의해 발생하는 특이적인 파장대로 스트레스, 노화에 민감하게 반응하는 영역이다(Gitelson and Merzlyak, 1994).

들잔디와 금잔디 잎의 초분광 반사율을 확인한 결과 두 종 모두 마모 스트레스 처리 이후 적색파장 영역은 평균 0.096에서 0.174로 반사율이 크게 증가하였고, 근적외선 영역은 평균 0.545에서 0.475로 반사율이 감소한 것을 알 수 있었다(Fig. 2). 이는 밀의 질소 스트레스(Ranjan et al., 2012), 사과나무의 수분 스트레스(Kim et al., 2011) 연구 보고에서도 이와 같은 경향이 나타났으며, 마모 스트레스 처리 이후 red-edge 영역이 마모 스트레스 처리 전 보다 왼쪽으로 이동해 red-edge 파장대가 짧아진 것을 알 수 있었다. 대부분의 식물은 스트레스를 받게 되면 red-edge 영역이 왼쪽으로 이동하게 되는 청색이동(blue-shift) 현상이 발생한다(Birth and McVey, 1968; Blackburn, 1998; Jiang et al., 2019; Jung et al., 2020; Li et al., 2022).

http://dam.zipot.com:8080/sites/WTS/images/N0260110408_image/Fig_WTS_11_04_08_F2.png

Fig. 2.Hyperspectral reflectance of Zoysia japonica and Z. matrella by wear stress treatment. Opaque colors are means hyperspectral reflectance standard deviation.

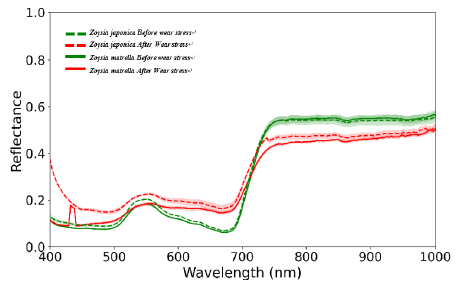
들잔디와 금잔디의 종간 마모 스트레스는 대조구에서 큰 차이가 없었으나, 녹색파장 영역인 550 nm에서 금잔디 반사율이 0.1860이었고 들잔디 반사율이 0.2063으로 반사율이 낮은 금잔디의 엽색이 좀 더 짙은 것을 알 수 있었다(Fig. 2). 마모 스트레스 처리 이후에도 금잔디보다 들잔디의 초분광 반사율이 높았으며, 들잔디에서 청색이동 현상이 더 크게 나타났다. 본 연구에서는 전체적인 초분광 반사율이 낮은 금잔디가 들잔디에 비해 마모 스트레스에 대한 저항성이 더 나은 결과를 나타내었다.

식생지수 변화

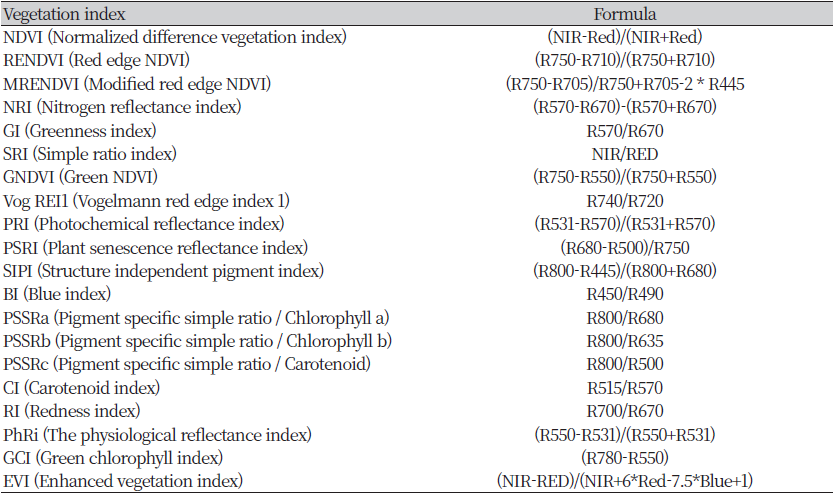
초분광 기기의 발달로 식물 스트레스 진단에 사용 가능한 다양한 식생지수들이 개발되었다(Table 1). NDVI (Normalized difference vegetation index)는 위성 데이터를 이용해 지표 식생 추정에 사용된 지수(Rouse et al., 1973)로 스트레스를 받으면 증가하는 적색파장 영역과 감소하는 근적외선 영역으로 계산된다. RENDVI (Red edge NDVI)는 스트레스나 노화에 민감하게 반응하는 red-edge를 사용해 NDVI를 개선한 식생지수(Gitelson and Merzlyak, 1994)이다. MRENDVI (Modified red edge NDVI) (Datt, 1999)와 GNDVI (Green NDVI)는 엽록소 함량에 민감하게 반응하는 지수(Gitelson and Merzlyak, 1998)로 red-edge와 녹색파장 영역을 이용한다. NDVI 계열의 식생지수를 비교하였을 때, 마모 스트레스 처리 후 들잔디의 NDVI가 0.7553에서 0.4797 로 감소(36.5%), RENDVI가 0.3245에서 0.1850로 감소(43.0%), MRENDVI가 0.5050에서 0.3959로 감소(21.6%), GNDVI가 0.4474에서 0.3487로 감소(21.6%) 되는 결과를 보였다. 금잔디에서도 NDVI가 0.7796에서 0.5043으로 감소(35.3%), RENDVI가 0.3612에서 0.2244로 감소(37.9%), MRENDVI가 0.5324에서 0.3619로 감소(32%), GNDVI가 0.4923에서 0.4088로 감소(17.0%)하여 마모 처리로 발생한 스트레스가 잔디의 생육 건전성을 떨어뜨리고 엽록소 함량을 감소시킨 것을 알 수 있었다(Table 2). 따라서 초분광에서 추출된 NDVI 계열의 식생지수 변화로 마모 스트레스 정량화가 가능한 것으로 판단되었다.

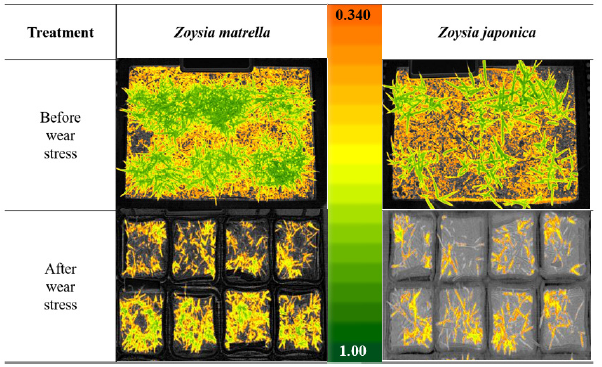
마모 스트레스에 의한 잔디 밀도 및 피해 양상을 알아보기 위해 NDVI 이미지를 사용하였다. 초분광 카메라로 반사율 및 식생지수를 추출하는 경우 관심영역의 데이터만으로 작물의 상태를 평가하기 때문에 조사하는 사람의 숙련도에 큰 영향을 받지만 식생지수를 통한 이미지 처리는 촬영된 작물의 전체 상태를 한눈에 관찰할 수 있어 가시성이 높고 데이터 왜곡의 우려가 현저히 줄어들기 때문에 식생지수 평가에 있어 이미지를 활용 하는게 필요하다. 마모 스트레스를 처리하기 전에는 들잔디와 금잔디의 NDVI 값은 유사했으나 금잔디에서 초기 생육 밀도가 높아 품질이 더 좋았다. 마모 스트레스 처리 후 들잔디는 대부분의 잎이 마모 스트레스로 인해 NDVI 값이 낮아진 것을 알 수 있었으며 밀도 역시 감소하였다. 상대적으로 금잔디는 들잔디 보다 NDVI 값과 피복율이 높은 것을 알 수 있었다(Fig. 3). 답압으로 피복율, 근적외선, NDVI가 감소하였다는 보고(Chin and Ow, 2016)와 금잔디가 들잔디에 비해 마모 스트레스 저항성이 높다는 보고(Youngner, 1961)를 통해 금잔디가 들잔디보다 마모 스트레스에 대해 더 강한 저항성을 나타냈으며, 마모 스트레스 처리 후에도 피복율 역시 높게 유지되는 것을 NDVI 이미지를 통해 확인할 수 있었다.

NRI (Nitrogen reflectance index)는 질소와 관련된 지수로 마모 스트레스로 인해 들잔디에서 68.7%, 금잔디에서 77% 감소하여 다른 식생지수 보다 크게 감소하여 마모 스트레스를 잘 감지하는 식생지수였다(Table 2). GI (Greenness index)는 마모 처리 후 들잔디48%, 금잔디에서 51% 감소하여 NRI보다 스트레스 반영이 적은 식생지수였다(Table 2). SRI (Simple ratio index)는 잔디에서 visual rating과 높은 상관관계를 가진 식생지수로 보고(Birth and McVey, 1968) 되었다. 마모 스트레스 처리 전 SRI는 들잔디 7.58, 금잔디 8.68이었으며, 마모 처리 이후 들잔디는 62% 감소한 2.85, 금잔디는 65% 감소한 3.07로 들잔디 보다 피복 밀도가 높은 금잔디에서 SRI가 높은 결과를 나타내었다(Table 2).

Vog REI1 (Vogelmann red edge index)는 red edge를 사용해 작물을 진단하는 지수이나 들잔디와 금잔디 모두 처리에 큰 반응을 보이지 않았다(Table 2). PRI (Photochemical reflectance index), SIPI (Structure independent pigment index), CI (Carotenoid index), RI (Redness index), PhRi (The Physiological reflectance index)는 마모 스트레스에 따른 변화폭이 크지 않아 마모 스트레스 진단에 유용한 식생지수가 아니였다(Table 2).

PSRI (Plant senescence reflectance index)는 식물 노화와 관련된 지수로 높을수록 노화가 많이 진행된 것을 의미하는데 들잔디에서 -0.0428에서 0.0381로 금잔디에서 -0.0329에서 0.0925로 증가하였다(Table 2).

BI는 Blue 영역을 사용하는 식생지수로 엽록소 및 병 진단에 사용되는데 들잔디에서 증가하고 금잔디에서는 감소하여 유용한 식생지수가 아닌 것으로 판단되었다(Table 2).

Table 1. Vegetation indices used to evaluate wear stress on zoysiagrass.

http://dam.zipot.com:8080/sites/WTS/images/N0260110408_image/Table_WTS_11_04_08_T1.png

Table 2. Variation of vegetation indices on Zoysia japonica and Z. matrella according to wear stress treatment by hyperspectral analysis.

http://dam.zipot.com:8080/sites/WTS/images/N0260110408_image/Table_WTS_11_04_08_T2.png
http://dam.zipot.com:8080/sites/WTS/images/N0260110408_image/Fig_WTS_11_04_08_F3.png

Fig. 3.NDVI imaging on Zoysia japonica and Z. matrella according to wear stress treatment by hyperspectral analysis.

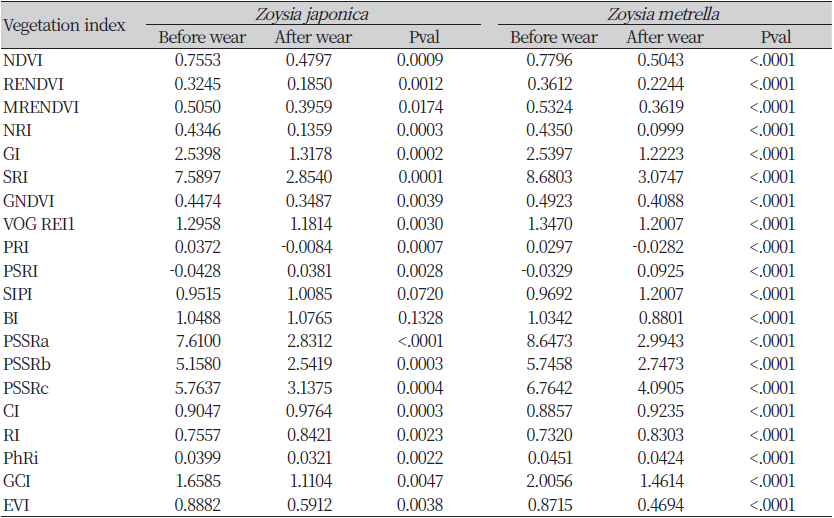
마모스트레스 처리 후 엽록소와 관련된 PSSRa (Pigment specific simple ratio / chlorophyll a), PSSRb, PSSRc, GCI (Green chlorophyll index)는 들잔디가 각각 63.0%, 56.9%, 45.6%, 33.0%, 금잔디가 각각 65.7%, 58.9%, 39.5%, 27.1%로 유의하게 감소하였다(Table 2). 특히 마모 스트레스 처리에 의해 PSSRa와 PSSRb의 감소 폭이 크게 나타나 GNDVI보다 PSSRa와 PSSRb가 마모 스트레스 정량적 평가에 더 유용할 것으로 판단되었다. 식생지수 분석으로 마모 스트레스 피해에 따른 변화를 확인할 수 있었으며 많은 식생지수가 마모 스트레스에 의해 변화하는 것을 알 수 있었다.

EVI (Enhanced vegetation index)는 높은 초관 수준의 식물을 진단하는데 적합한 지수(Huete et al., 2002)이다. 마모 스트레스 처리 전 들잔디 0.888, 금잔디 0.872로 나타나 잔디의 피복율과 관계없이 두 종간 차이가 크지 않았다(Table 2). 마모 스트레스 처리 후 EVI 는 들잔디 33.4%, 금잔디 46.1%가 감소하였다(Table 2). 따라서 EVI는 초관 밀도가 높은 잔디에서 사용하기 유용한 지수로 판단되었다.

본 연구에서 마모 스트레스 평가를 위해 작물 평가에 널리 사용되는 NDVI 계열 식생지수를 이용하였으며 그 중 가장 효과적인 식생지수는 RENDVI이었다. NDVI 이미지 평가는 잔디의 밀도나 엽 내 품질을 쉽게 확인할 수 있는 장점이 있어 스트레스 전후 식생지수를 평가할 때 유용하게 사용될 수 있을 것으로 판단되었다. NDVI 계열 외 여러가지 식생지수로 마모 스트레스를 평가한 결과 NRI, PSSRa, PSSRb가 다른 식생지수 보다 민감하게 반응하는 것으로 나타났다.

Acknowledgements

This research was funded by the Forest Biomaterial Research Center, National Institute of Forest Science (Project No. FG0900- 2020-01).

Authors Information

Jae-Gyeong Jung, Forest Biomaterials Research Center, National Institute of Forest Science, Postmaster researcher

Jun-Hyuck Yoon, Forest Biomaterials Research Center, National Institute of Forest Science, Researcher

Eon-Ju Jin, Forest Biomaterials Research Center, National Institute of Forest Science, Postdoctoral researcher

Kwon-Seok Jeon, Forest Biomaterials Research Center, National Institute of Forest Science, Researcher

Young-Sun Kim, Daegu University, Professor

Eun-Ji Bae, http://orcid.org/0000-0003-4597-8873

References

1 Ashourloo, D., Mobasheri, M. and Huete, A. 2014. Developing two spectral disease indices for detection of wheat leaf rust (Puccinia triticina). Remote Sens. 6:4723-4740.  

2 Askari, M.S., McCarthy, T., Magee, A. and Murphy, D.J. 2019. Evaluation of grass quality under different soil management scenarios using remote sensing techniques. Remote Sens. 11:1835.  

3 Badzmierowski, M.J., McCall, D.S. and Evanylo, G. 2019. Using hyperspectral and multispectral indices to detect water stress for an urban turfgrass system. Agronomy. 9:439.  

4 Bae, E.J., Lee, K.S., Park, N.C. and Huh, M.R. 2012. Comparison of oxidative damage in zoysiagrass (Zoysia spp.) with environmental stress. J. Korean Soc. People Plants Environ. 15(2):107-113.  

5 Bae, E.J., Cho, H.M., Yoon, J.H., Jin, E.J. and Lee, G.J. 2021. Correlation analysis between MDA content morphological characteristics of zoysiagrass accessions as an index of wear tolerance. Weed Turf. Sci. 10(4):387-395.  

6 Birth, G.S. and Mcvey, G.R. 1968. Measuring the color of growing turf with a reflectance spectrophotometer. Agron. J. 60(6):640-643  

7 Blackburn, G.A. 1998. Quantifying chlorophylls and carotenoids at leaf and canopy scales: an evaluation of some hyperspectral approaches. Remote Sens. Environ. 66:273-285.  

8 Chin, S.W. and Ow, L.F. 2016. Performance of Zoysia spp. and Axonopus compressus turf on turf-paver complex under simulated traffic. Weed Turf. Sci. 5(2):88-94  

9 Chang, S.W., Bae, E.J., Kim, K.D. and Lee, J.H. 2020. Investigation on turfgrass growth environment in natural turfgrass playgrounds of 22 elementary, middle, and high schools in South Korea. Weed Turf. Sci. 9(2):159-168.  

10 Chang, S.W., Lee, J.H., Bae, E.J. and Kim, S.H. 2022. A study on the actual use of pesticides on natural turfgrass school playgrounds in Korea and the perception of chemical pesticides among school staffs. Weed Turf. Sci. 11(3):289-296.  

11 Clack, M.L. 2017. Comparison of simulated hyperspectral HyspIRI and multispectral Landsat 8 Sentinel-2 imagery for multi-seasonal, regional land-cover mapping. Remote Sens. Environ. 200:311-325.  

12 Datt, B. 1999. A New reflectance index for remote sensing of chlorophyll content in higher plants: tests using Eucalyptus leaves. J. Plant. Physiol. 154:30-36.  

13 Gitelson, A. and Merzlyak M.N. 1994. Spectral reflectance changes associated with autumn senescence of Aseculus hippocastanum L. and Acer platanoides L. leaves. spectral features and relation to chlorophyll estimation. J. Plant Physiol. 143:286-292.  

14 Gitelson, A. and Merzlyak, M.N. 1998. Remote sensing of chlorophyll concentration in higher plant leaves. Adv. Space Res. 22(5):689-692.  

15 Han, S.W., Soh, H.S., Won, S.Y. and Ju Y.C. 2015. Present state of turf management of school playgrounds in Gyeonggi province of Korea. Weed Turf. Sci. 4(4):405-412.  

16 Hlavinka, J., Nauš, J. and Špundová, M. 2013. Anthocyanin contribution to chlorophyll meter readings and its correction. Photosynth. Res. 118:277-295.  

17 Huete, A., Didan, K., Miura, T., Rodriguez, E.P., Gao, X. and Ferreira, L.G. 2002. Overview of the radiometric and biophysical performance of the MODIS vegetation indices. Remote Sens. Environ. 83:195-213.  

18 Jiang, C., Chen, Y., Wu, H., Li, W., Zhou, H., et al. 2019. Study of a high spectral resolution hyperspectral LiDAR in vegetation red edge parameters extraction. Remote Sens. 11:2007.  

19 Jung, J.G., Lee, Y.H., Choi, J.E., Song, G.E., Ko, J.H., et al. 2020. Changes in the hyperspectral characteristics of wheat plants according to N top-dressing rates at various growth stages. Korean J. Crop Sci. 65(4):377-385.  

20 Kanning, M., Kühling, I., Trautz, D. and Jarmer, T. 2018. High-resolution UAV-based hyperspectral imagery for LAI and chlorophyll estimations from wheat for yield prediction. Remote Sens. 10(12):2000.  

21 Kim, Y., Gelnn, D.M., Part, J., Ngugi, H.K. and Lehman, B.L. 2011, Hyperspectral image analysis for water stress detection of apple trees. Comput. Electron. Agric. 77:115-160.  

22 Kjeldahl, J. 1883. Nenu methode zur bestimmung des stickstoffs in organischen körpern. Zeitschrift für analytische Chemie. 22:366-382.  

23 Lee, J.M. and Lee, T.K. 2021. Development of evaluation tool of school sport facility for analysis of environmental characteristics. JAIK. 37(2):163-172.  

24 Li,B., Xu, X., Zhang, L., Han, J., Bian, C., et al. 2020. Above-ground biomass estimation and yield prediction in potato by using UAV-based RGB and hyperspectral imaging. ISPRS J. Photogramm. Remote Sens. 162:161-172.  

25 Li, Q., Gao, M. and Li, Z.L. 2022. Ground hyper-spectral remote-sensing monitoring of wheat water stress during different growing stages. Agronomy 12:2267.  

26 Liu, Z., Huang, J. and Tao, R. 2008. Characterizing and estimating fungal disease severity of rice brown spot with hyperspectral reflectance data. Rice Sci. 15(3):232-242.  

27 Lu, B., Dao, P. D., Liu, J. He, Y. and Shang, J. 2020. Recent advances of hyperspectral imaging technology and applications in agriculture. Remote Sens. 12:2659.  

28 Mæhre, H.K., Dalheim, L., Edvinsen, G.K., Elvevoll, E.O. and Jensen, I.J. 2018. Protein determination-method matters. Foods 7(1):5  

29 Moharana, S. and Dutta, S. 2016. Spatial variability of chlorophyll and nitrogen content of rice from hyperspectral imagery. ISPRS J. Photogramm. Remote Sens. 122:17-29.  

30 Muñoz-huerta, R.F., Guevara-gonzalez, R.G., Contreras-medina, L.M., Torres-Pacheco, I., Prado-olivarez, J., et al. 2013, A review of methods for sensing the nitrogen status in plants: advantages, disadvantages and recent advances. Sensors. 13:10823-10843.  

31 Ranjan, R., Chopra, U.K., Sahoo, R.N., Singh, A.K. and Pradhan, S. 2012. Assessment of plant nitrogen stress in wheat (Triticum aestivum L.) through hyperspectral indices. Int. J. Remote Sens. 33(20)-6342-6360.  

32 Ritchie, R.J. 2008. Universal chlorophyll equations for estimating chlorophylls a, b, c, and d and total chlorophylls in natural assemblages of photosynthetic organisms using acetone, methanol, or ethanol solvents. Photosysthetica 46(1):115-126.  

33 Rouse, J.W., Haas, R.H., Schell, J.A. and Deering, D.W. 1973. Monitoring the vernal advancement and retrogradation (green wave effect) of natural vegetation. NASA 1-120.  

34 Sabins, F.F. 1999. Remote sensing for mineral exploration. Ore Geol. Rev. 14:157-183  

35 Wintermans, J.F.G.M. and De mots, A. 1965. Spectrophotometric characteristics of chlorophylls a and b and their pheophytins in ethanol. Biochem. Biophys. Acta. 109(2):448-453.  

36 Youngner, V.B. 1961. Accelerated wear tests on turfgrass. Agron. J. 53(4):217-218.  

37 Zarco-Tejada, P.J., Miller, J.R., Mohammed, G.H., Noland, T.L. and Sampson, P.H. 2002. Vegetation stress detection through chlorophyll a + b estimation and fluorescence effects on hyperspectral imagery. J. Environ. Qual. 31(5):1443-1441.  

38 Zhang, K., Yuan, Z., Yang, T., Lu, Z., Cao, Q., et al. 2018. Chlorophyll meter-based nitrogen fertilizer optimization algorithm and nitrogen nutrition index for in-season fertilization of paddy rice. Agron. J. 112(1):288-300.