Introduction
The genus Zoysia comprises numerous warm-season turfgrass species indigenous to East Asia, recognized for their endurance, versatility, and extensive use in landscaping. These are commercially important plants valued for their lushness and softness. They are cultivated worldwide to enhance residential lawns, playgrounds, and public areas while also significantly contributing to the global commercialization of grasses by various industries, such as the US turfgrass sector, which prioritizes them as ornamental plants due to their resilience to saline conditions, droughts, and other stress factors (Patton et al., 2017).
In South Korea, Z. japonica, Z. matrella, Z. macrostachya, Z. sinica, Z. tenuifolia, and the hybrid Z. koreana are prevalent. Historically, species classification has posed difficulties owing to overlapping physical characteristics and the impact of interspecific hybridization. Previous research mostly relied on morphological assessments and a restricted set of genetic markers, which were inadequate for precise separation. Preliminary research, such as that conducted by Yu et al. (1974), concentrated on the morphological categorization of Zoysia species but revealed considerable overlap, indicating intermingling among Z. japonica, Z. matrella, and Z. koreana. Subsequent investigations by Hong and Yeam (1985) into cross ability and hybrid characteristics highlighted the intricacy of these interspecific interactions. Variations in allele frequencies within a population may result in the development of adaptive traits. The assessment of genetic diversity to identify groups with analogous genotypes is crucial for the conservation, evaluation, and utilization of genetic resources, for examining the diversity of various germplasm as potential gene sources to enhance cultivar performance, and for establishing the uniqueness and distinctiveness of the phenotypic and genetic makeup of genotypes to safeguard the breeder.
The genetic variety of the grass plant is continually investigated by researchers globally due to its economic, medical, and worldwide interests. Numerous molecular markers, including Sequence Characterized Amplified Region (SCAR), Simple Sequence Repeats (SSR), Random Amplified Polymorphic DNA (RAPD), Inter Simple Sequence Repeat (ISSR), microsatellite, Amplified Fragment Length Polymorphism (AFLP), Restriction Fragment Length Polymorphism (RFLP), and Cleaved Amplified Polymorphic Sequence (CAPS), were employed to investigate genetic diversity in zoysiagrasses across various studies (Hong et al., 2017; Jessup et al., 2011; Kimball et al., 2012, 2013; Matsuda et al., 2012; Tanaka et al., 2016; Tsuruta et al., 2008; Wang et al., 2023; Weng, 2002; Weng et al., 2007; Xie, 2012; Yaneshita et al., 1997). Studies by Cai et al. (2004), Jessup et al. (2011), Li et al. (2010), and Yaneshita et al. (1999) have shown the genetic variation of Zoysia. Nonetheless, this research was constrained by the absence of comprehensive genetic analysis methods. Progress in molecular genetics, especially the use of AFLP (amplified fragment length polymorphism) markers calls for a more comprehensive analysis of genetic linkages and variation. AFLP markers are very efficient owing to their repeatability and capacity to identify several polymorphic loci across the genome, making them ideal for evaluating population structure and hybridization. This research utilizes AFLP markers to investigate the genetic diversity, connections, and hybridization of Zoysia species in South Korea. This thorough research enhances comprehension of the genetic landscape of Zoysia species, guiding future breeding and conservation initiatives.
Materials and Methods
Sampling Strategy and Plant Material
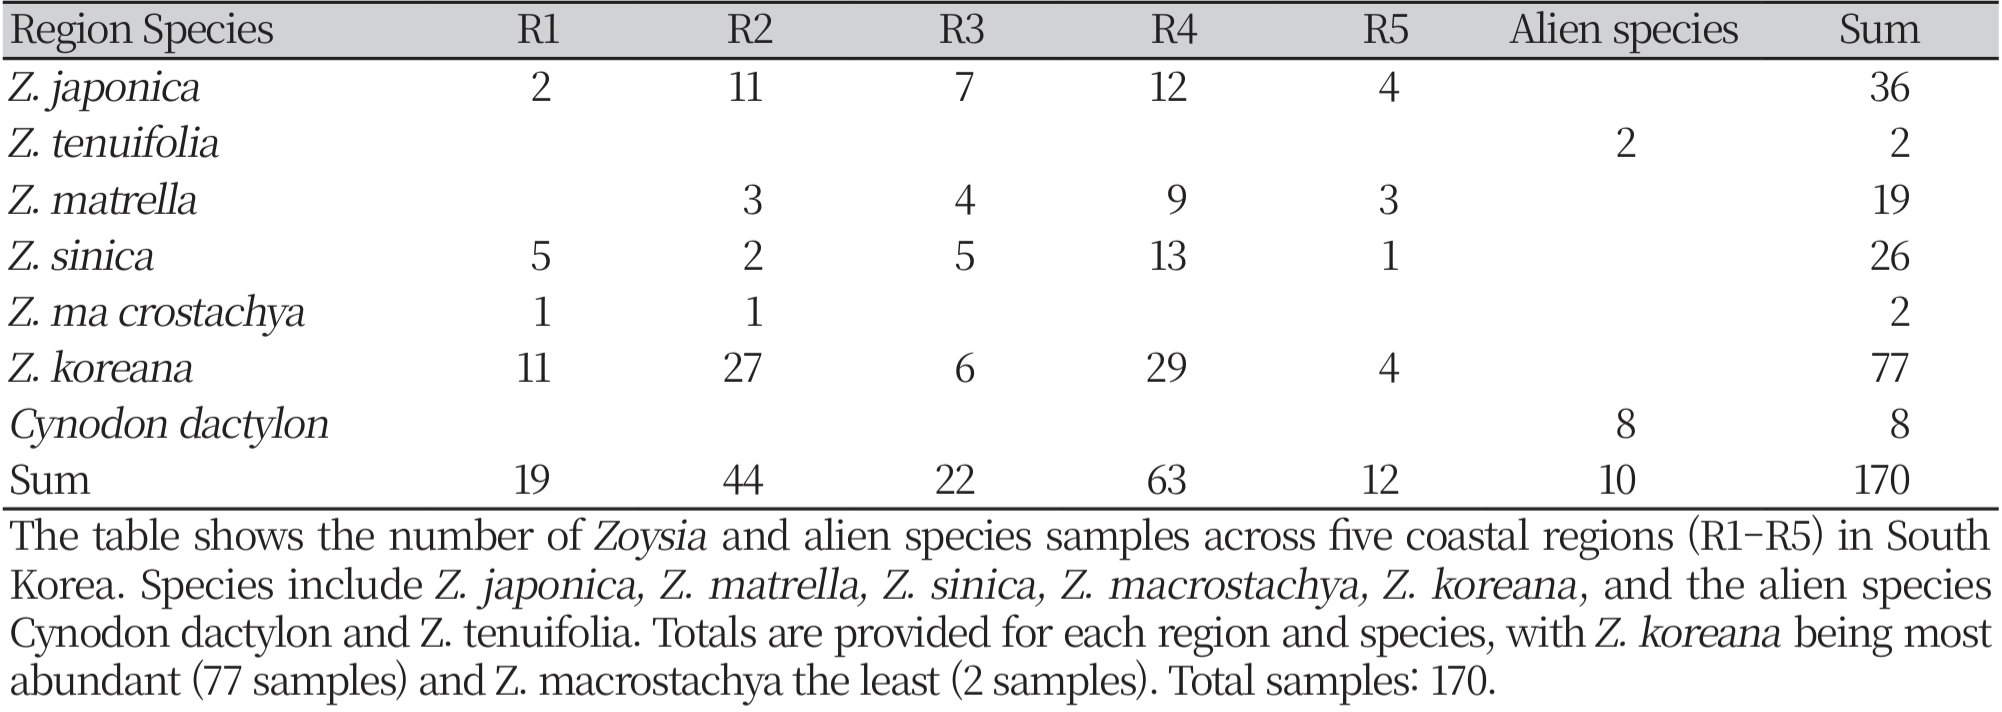
All the turfgrasses used in this study were grown at the Turfgrass Genetic Resources Conservation Field (TGRCF), Forest Biomaterials Research Center. Jinju, South Korea. A total of 170 genotypes belonging to six species of zoysiagrass, including Z. japonica, Z. macrostachya, Z. sinica, Z. matrella, Z. tenuifolia, Z. koreana, and an overseas collection Z. tenuifolia. Figure 1 shows the regions where those genotypes were collected domestically. In accordance with Lee et al. (1994), each sample was carefully identified using morphological parameters, such as leaf width, seed characteristics, and rhizome kinds, which were then confirmed by AFLP analysis. As an outgroup, we additionally used another warm-season bermudagrass (Cynodon dactylon). To avoid sampling from geographically related individuals, we rigorously ensured that samples were taken at least 100 m apart.
DNA extraction and AFLP marker analysis
The collected samples’ genomic DNA (gDNA) was extracted from spikelets using the Qiagen DNeasy Plant Kit as per the manufacturer’s instructions with some changes (Qiagen Sciences, Germantown, MD, USA). The concentration and purity of gDNA were determined using a UV spectrophotometer and 2% agarose-1x TAE gel electrophoresis. The Amplified Fragment Length Polymorphism (AFLP) experiment was performed employing high-quality gDNA from selected plants. We performed the AFLP analysis using the EcoRI and MseI adapter integrated protocol, following Vos et al. (1995) with minor modifications. Pre-selective amplification was conducted utilizing primer sets homologous to the adapter sequences with an additional single selective nucleotide. Selected amplification employed five dye-labelled primer pairs that each incorporated two chosen nucleotides: ACA (FAM)/CAG, ACA (FAM)/CAC, AAC (NED)/CAG, AAC (NED)/CAC, and ACG/JOE-CAG. The following parameters were used for AFLPPCR: initial denaturation at 94 °C for two minutes, followed by 30 cycles of denaturation at 94 °C for 30 seconds, annealing at 56 °C for one minute and extension at 72 °C for one minute, and concluding extension at 72 °C for 10 minutes. The AFLP amplicons were sequenced using the ABI 3130 genetic analyzer and the sequences were interpreted using GeneMapper software (v4.0) (Applied Biosystems, Carlsbad, CA, USA). Each fragment was scored as present (1) or absent (0) to construct a binary matrix representing AFLP profiles across samples.
Genetic Data Analysis
Genetic diversity was calculated via Shannon’s index to access the polymorphism profile among and within populations based on the allele frequencies. The genetic variation across populations, regions, and species was assessed by the Analysis of Molecular Variation (AMOVA) technique. Variance components and significance levels were assessed using Arlequin software (version 3.5.2.2).
In this research, populations denote groupings of individuals of the same species collected from particular locations (e.g., aponicad R2), while species indicate separate taxonomic categories (e.g., Z. japonica, Z. sinica). Regions (R1–R5) denote geographic locations from where samples were obtained. Genetic variance among regions denotes variations between different regions (e.g., R1 vs. R2). Genetic variance among populations pertains to variations within populations of the same species (e.g., Z. japonica in R1 vs. R2). Genetic variance among species emphasizes variances between different species (e.g., Z. japonica vs. Z. sinica). Genetic diversity within populations refers to the variation among individuals within the same population (e.g., Z. japonica in region R1). This contrasts with the genetic variation observed among all individuals within a region (e.g., all species in R1) or the variation within a single species across multiple regions (e.g., Z. japonica across regions R1–R5).
We classified the genetic groups based on individuals within and among species using k-means clustering (k = 7). The genetic linkages were studied via the Unweighted Pair Group Method with Arithmetic Mean (UPGMA) dendrogram. The hybridization patterns were investigated using a NewHybrids software (version 1.0), and the hybrid classification was assessed based on Bayesian probability as two models: Model I (considering Z. japonica and Z. sinica as putative parents) and Model II (considering Z. japonica and Z. matrella as putative parents). A classification criterion of 90% likelihood was used. Statistical verification and representation: PhiPT values were computed to assess genetic differentiation at several hierarchical levels, including among-region, amongpopulation, and overall differentiation. Statistical significance was evaluated using 99 permutations to validate the robustness of the PhiPT findings.
Data visualizations, such as bar charts, scatter plots, and stacked bar charts, were created to illustrate species distribution, clustering patterns, hybridization classifications, AMOVA variance distribution, and PhiPT. Graphs were generated using ggplot2 (version:3.5.1) in R studio (version: 2024.09, Posit, Massachusetts, USA) and OriginPro 8 (Origin Lab Corp., Northampton, Massachusetts, USA) on Windows 8.0.
Results and discussion
Genetic diversity and polymorphism and Molecular variance analysis (AMOVA)
The AFLP evaluated the genetic diversity profile both within and among 170 samples of Zoysia species, including Z. macrostachya, Z. sinica, Z. matrella, and the hybrid Z. koreana, along with the outgroups Z. tenuifolia and Cynodon dactylon, collected from five distinct regions of Korea (Fig. 1 & 3; Supplementary Table 1). The Shannon Index distinctly indicated the notable polymorphisms prevalent, particularly within Zoysia populations. Significant genetic diversity was observed in the hybrid Z. koreana among the species. The total variation within the population is approximately 91.64%, within the species is 69.56%, and within individual populations is 66.35%, indicating a consistent impact of local evolutionary processes (Fig. 2). Consequently, 8.36% of the variance was observed among regions, 30.44% among species, and 33.65% among populations, suggesting that genetic divergence is influenced more by population-level than by geographical isolation (Fig. 2).
Fig. 1
Geographic distribution of sampling regions (R1–R5) for Zoysia species across South Korea. Each region is highlighted with blue ovals, and green triangles represent sampling sites within these regions. The regions include R1 (northwest coast), R2 (southwest coast and islands), R3 (southern coast), R4 (southeast coast), and R5 (east coast). The scale bar denotes 50 km for spatial reference.
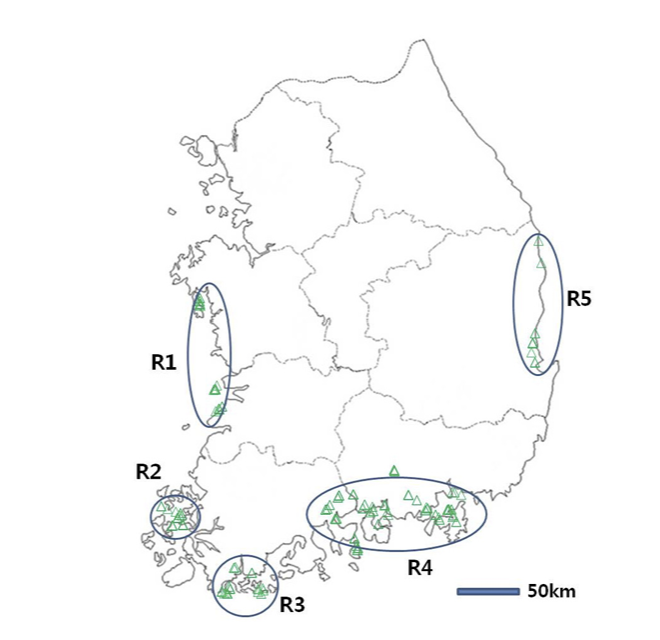
Fig. 3
AMOVA-based partitioning of genetic variation in Zoysia species collected across South Korea. The bar chart represents the percentage of total genetic variance attributed to six sources: among populations (33.65%), among regions (8.36%), among species (30.44%), within populations (66.35%), within regions (91.64%), and within species (69.56%). These results highlight the major contributions of within-region and within-species variations to the overall genetic diversity.
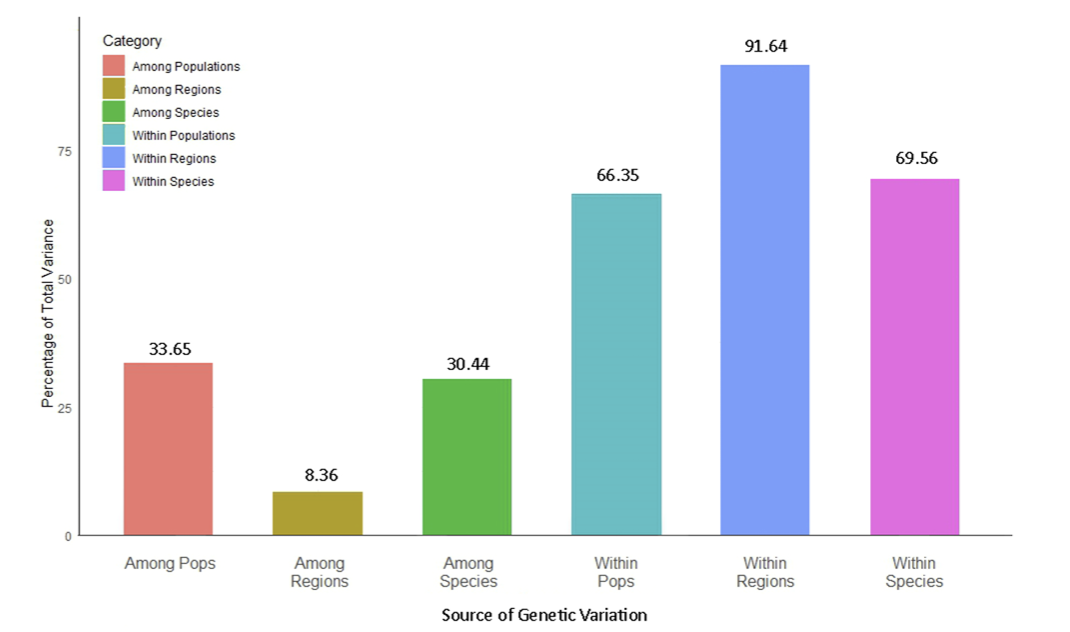
Fig. 2
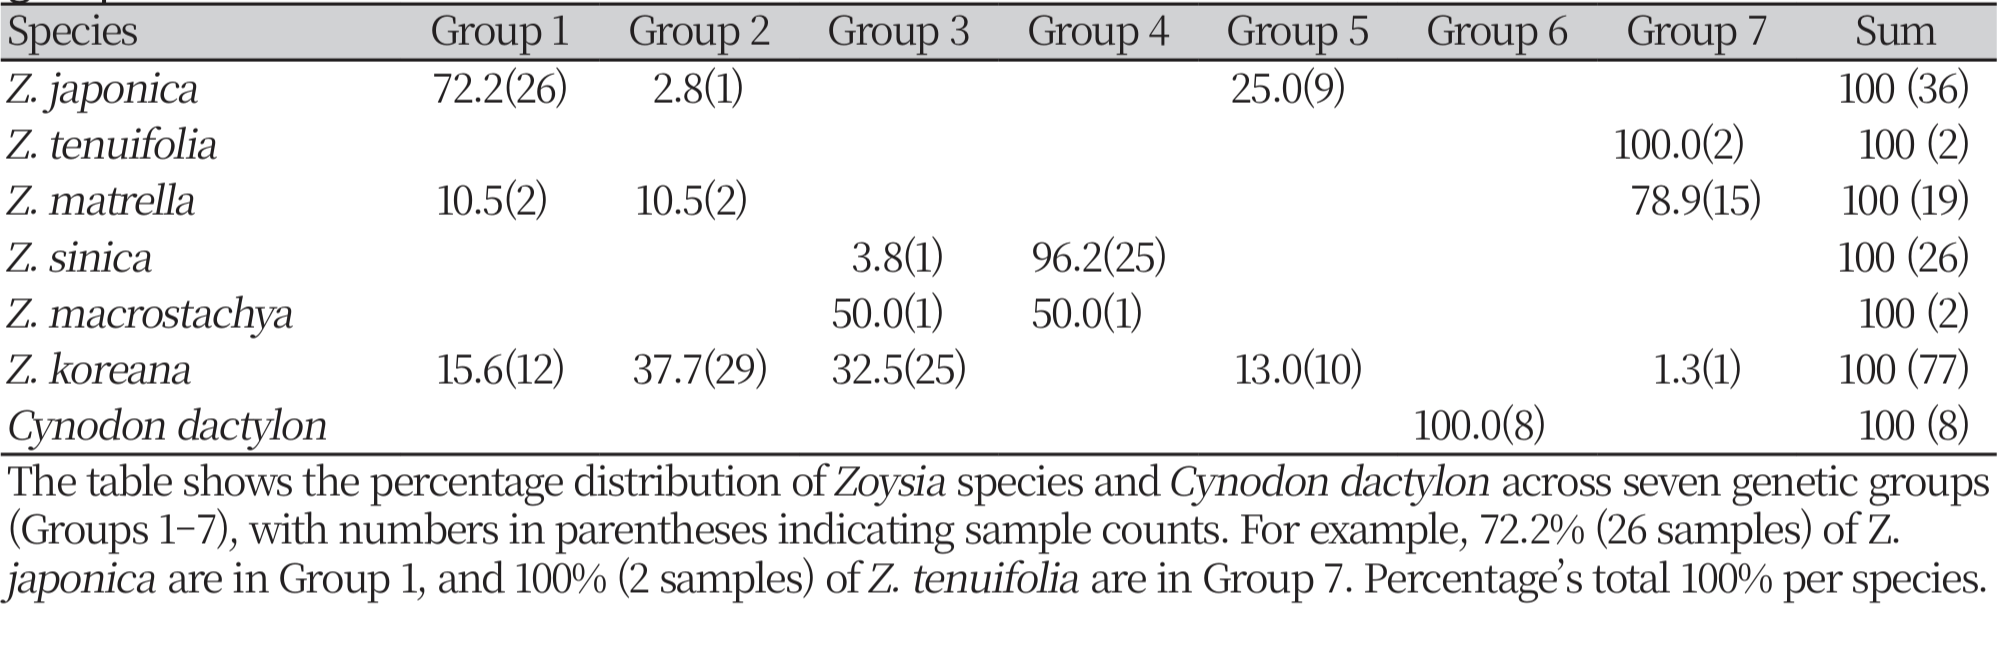
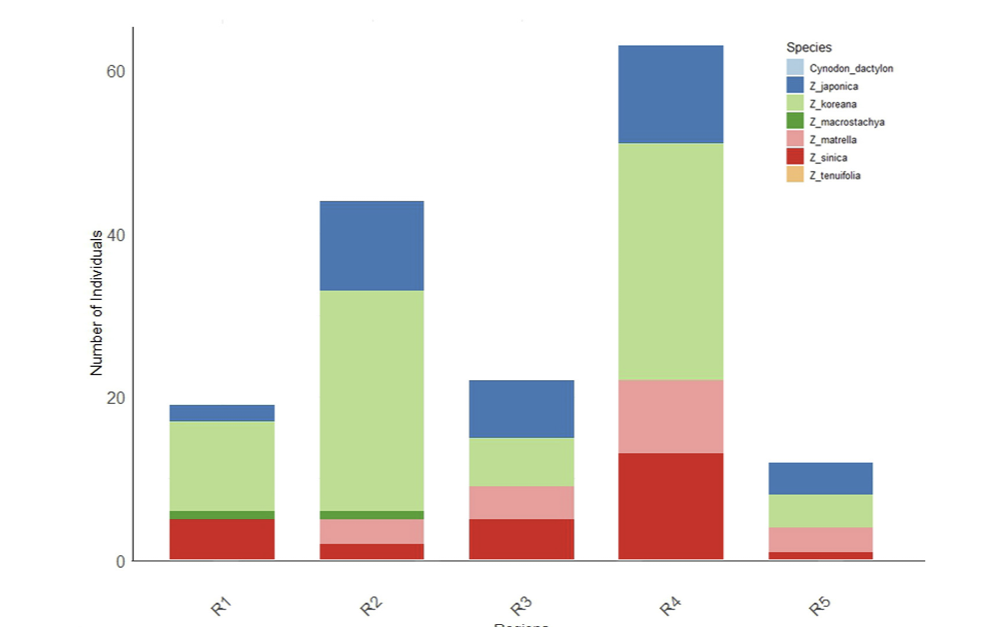
Species Distribution Across Regions. The stacked bar chart illustrates the distribution of different Zoysia species and the alien species Cynodon dactylon across five coastal regions (R1 to R5) in South Korea. Each bar represents the total number of individuals sampled in a region, with colors indicating the contribution of each species. Z. koreana dominates most regions, particularly R2 and R4, while Cynodon dactylon is exclusively found in R5. The legend identifies each species represented by a specific color in the chart.
The significant genetic heterogeneity within the Zoysia population indicated the durability of ecological adaptation influenced by local environmental factors, including soil composition, salt, moisture, and temperature. The diversity across populations, as measured by Shannon’s index, demonstrated a wide range of allelic variation, therefore highlighting the presence of substantial genetic resources essential for long-term adaptation. Kimball et al. (2012) found similar results in the United States and Southeast Asia, Tanaka et al. (2016) in Japan, and Weng et al. (2007) in Taiwan, confirming that the Zoysia population contains significant genetic diversity, with our study indicating a notable polymorphism of 66.35%. Although multiple techniques including AFLP, SSR, and RAPD markers were used to investigate Zoysia's genetic diversity, the results clearly demonstrated stable genetic variation within populations.
The AMOVA study distinctly demonstrated a maximum genetic variation of 91.64% within the population, underscoring the substantial influence of local evolutionary processes on Zoysia's genetic diversity (Fig. 2). Conversely, the regional genetic diversity was low at 8.36%, suggesting that geographical isolation and regional barriers had little impact on genetic differentiation (Fig. 2). The PhiPT analysis corroborated these findings by indicating that the highest genetic variation (33.65%) was seen across communities, underscoring substantial population-level differences (Fig. 4). Conversely, just 8.36% of the variation was seen across areas, indicating little regional difference. The PhiPT value of 41.23% indicates that geographical differences are minimal; population-level genetic variation significantly influences the genetic structure of Zoysia species (Fig. 4-6). The PhiPT investigation demonstrated that the genetic variation of Zoysia is nearly thrice greater in a species-specific context (0.28) compared to a regionspecific framework (0.08), attributable to massive evolutionary changes rather than short-term random effects (Fig. 4-6). The geographical variation in AMOVA findings could also reflect environmental diversity and gene flow between populations in the studied locations. Possibly owing to environmental conditions or their larger geographical reach, Tanaka et al. (2016) identified more Zoysia ecotype differentiation in Japan than in our research.
Fig. 4
PhiPT-based percentage of genetic variation among Zoysia populations and regions in South Korea. The bar chart displays the genetic differentiation as measured by PhiPT values, with contributions from among populations (PhiPR: 33.65%), among regions (PhiRT: 8.36%), and total genetic differentiation (PhiPT: 41.23%). These metrics highlight the genetic structure within Zoysia species across populations and regions.
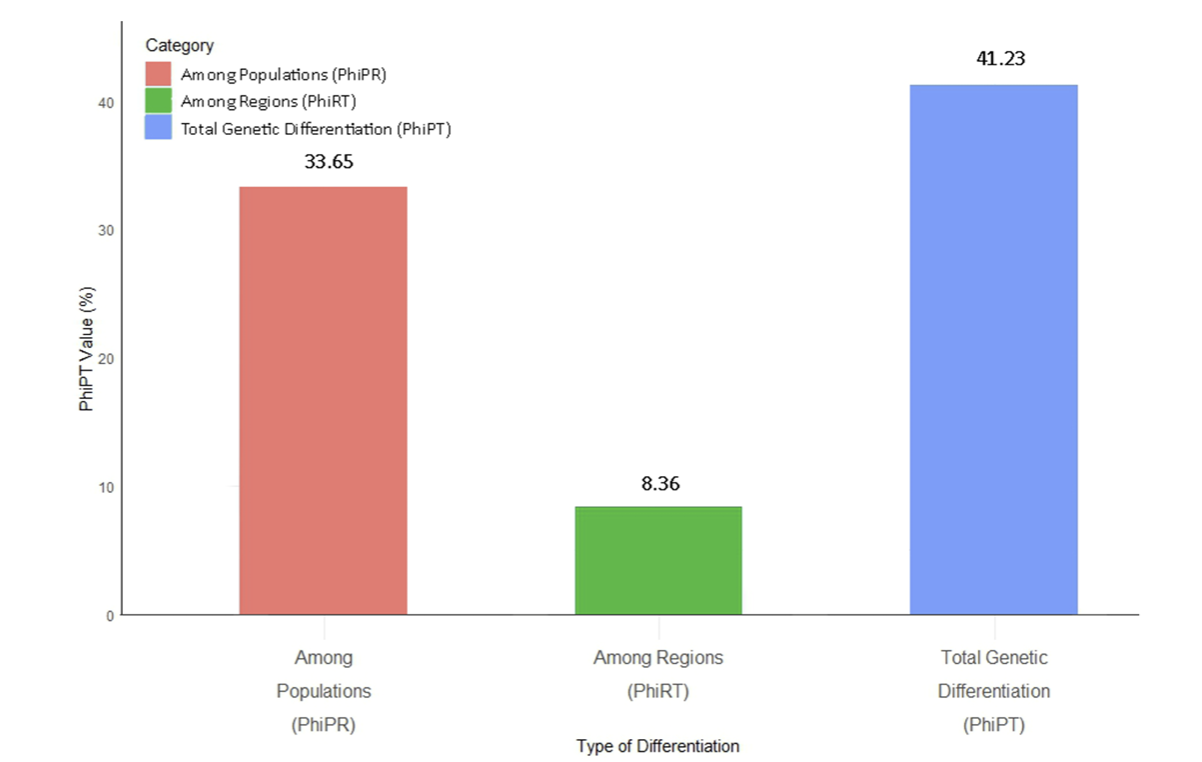
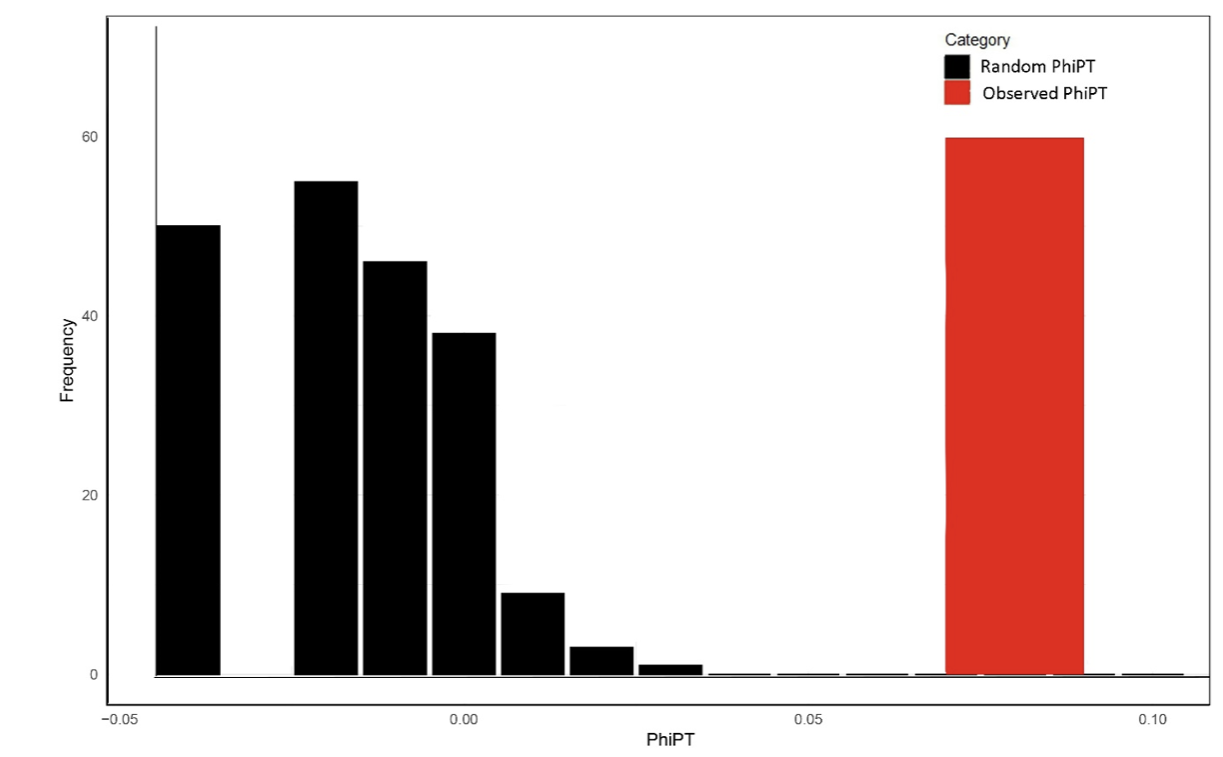
Fig. 5
Frequency distribution of PhiPT values among Zoysia species populations. The histogram shows the distribution of random PhiPT values (black bars) generated through permutation tests, representing the null hypothesis of no genetic differentiation. The observed PhiPT value (red bar) indicates the actual genetic differentiation among populations, which is significantly higher than the random distribution, highlighting structured genetic variation.
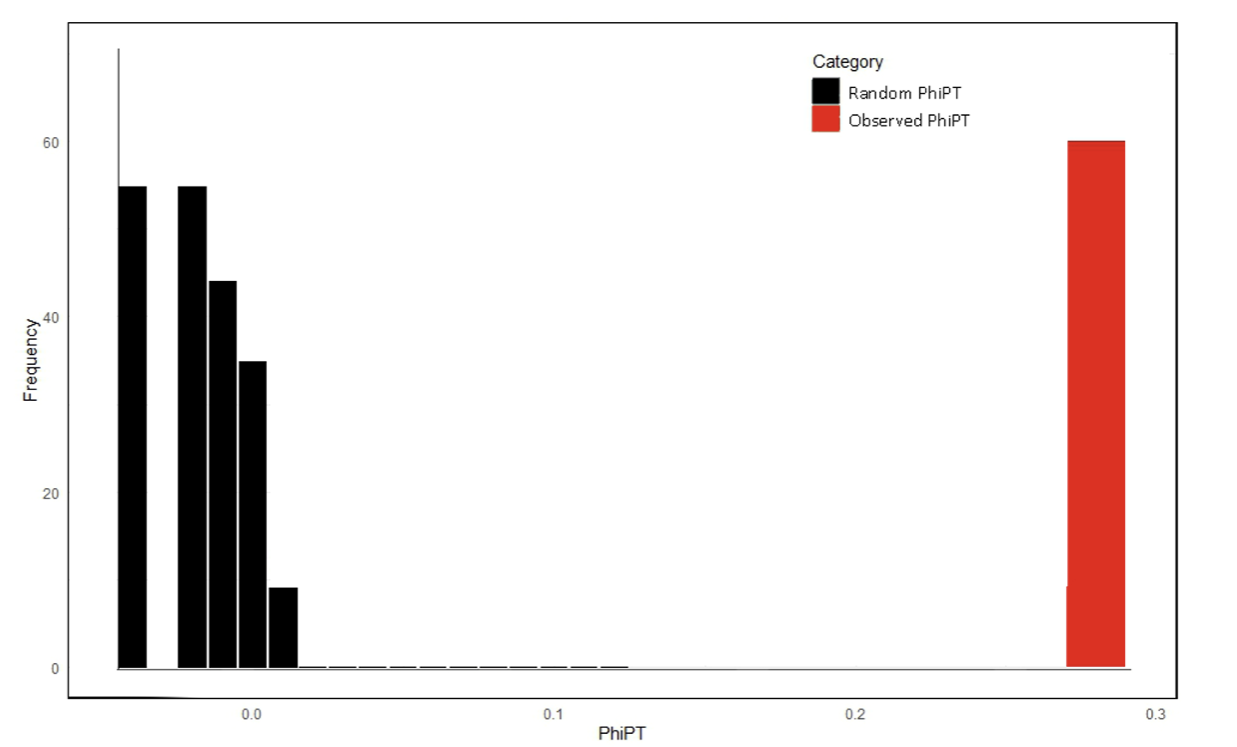
Fig. 6
Frequency distribution of PhiPT values among Zoysia species across regions. The histogram illustrates the distribution of random PhiPT values (black bars) generated through permutation tests under the null hypothesis of no genetic differentiation among regions. The observed PhiPT value (red bar) reflects the actual genetic differentiation among regions, which is significantly higher than the random distribution, indicating substantial genetic structuring among regions.
Species distribution across regions and genomic clustering and grouping.
Z. koreana was the most extensively dispersed species, accounting for 77 samples. It showed a large representation in regions 2 (36 samples) and 4 (29 samples), indicating a significant ecological adaptation across coastal habitats. Z. japonica had a well-defined distribution across all regions, particularly in region 3 (12 samples), region 2 (two samples), and region 5 (four samples) (Fig. 1, 3 and 7). Z. sinica was found in region 4 (13 samples), followed by region 3 and region 1, where it was less common. Z. matrella showed a reduced distribution throughout regions, but it was widely dispersed in region 3 (R3, 9 samples) (Fig. 5, 6). Z. macrostachya was infrequently found, with only two samples in regions 2 and 2 samples in region 3. The 8 samples of C. dactylon and 2 samples of Z. tenuifolia were widely scattered in the region 5 coast (Fig. 3). These findings shed light on the ecological distribution of Z. koreana across all species. The AMOVA findings (Fig. 2) also support that genetic variation occurs predominantly inside a population rather than across regions. Tanaka et al. (2016) and Kimball et al. (2012) uncovered consistent and larger genetic differences on a regional scale, but our analysis identified only 8.36% region-wise differentiation. This might account for geographical, environmental, and ecological aspects, as well as a wide range of sample analyses.
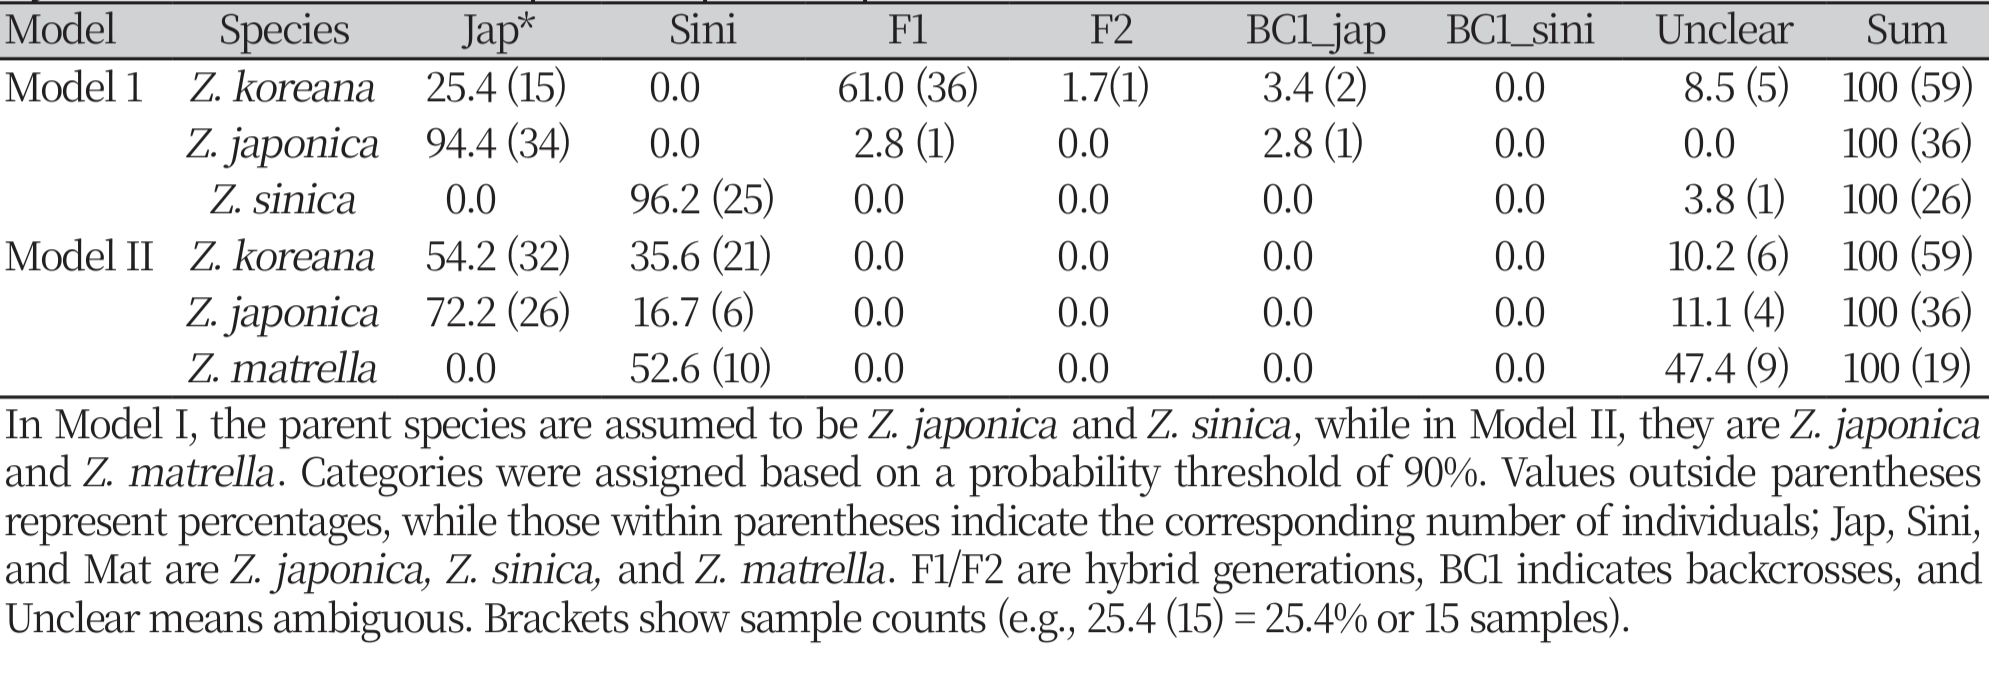
In the k-means clustering analysis (k = 7) and UPGMA dendrogram-based genetic similarity assessment, the Z. Koreana was found to be scattered over many clusters, indicating its intricate genomic origin among the seven unique genetic groupings of Zoysia samples. Z. japonica and Z. sinica were categorized into distinct groups (1 and 4, respectively) (Fig. 7; Supplementary Table 2), although Z. matrella exhibited overlap with Z. japonica, indicating a close genetic affinity. The outgroups C. dactylon and Z. tenuifolia exhibited different clusters, underscoring their genetic divergence from local Zoysia species. While distinct clusters for Z. sinica and Z. macrostachya indicated clearer genetic separations, overlaps among other species underscored ongoing gene flow and adaptive strategies within their shared environments.
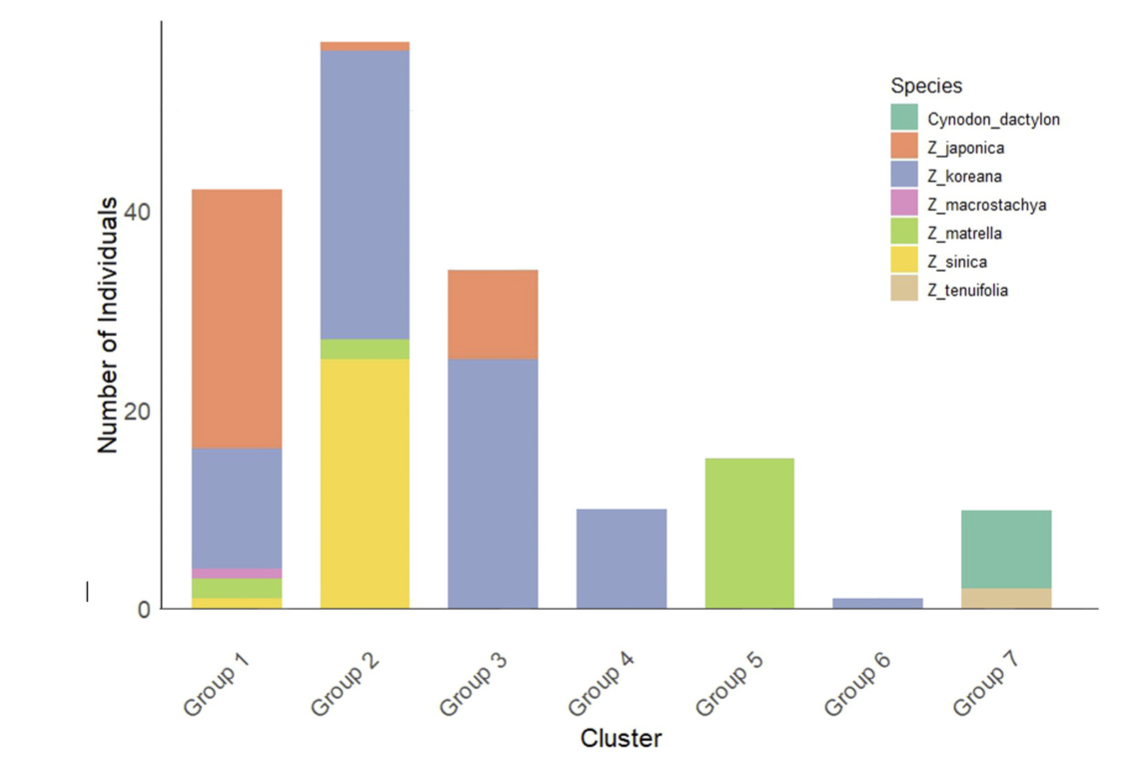
Fig. 7
K-means clustering of Zoysia species in South Korea (k = 7). The bar chart shows the number of individuals assigned to each of the seven genetic clusters (Groups 1–7) based on K-means analysis. Each bar is color-coded to represent the species composition within each cluster, including Z. japonica, Z. koreana, Z. matrella, Z. sinica, Z. tenuifolia, and the alien species Cynodon dactylon. The distribution highlights the genetic structure and diversity within the sampled populations.
Genetic relationships, hybridization, and genetic complexity
Pairwise genomic assessments between species indicated different levels of genetic relatedness. Z. japonica and Z. matrella had the closest genetic link, with many individuals from both species belonging to the same genetic groups (Fig. 8-10). This shows that these species have similar genetic memories or that there was previous gene flow between them. On the other hand, Z. sinica exhibited a higher genetic divergence from Z. japonica and Z. matrella (Fig. 8-10), thereby highlighting its evolutionary uniqueness. The k-means clustering analysis verified this genetic distinction (Fig. 7), as Z. sinica was largely found in group 2, while the other species had more overlapping genetic profiles.
Fig. 8
Comparative pairwise scatter plots of genetic variation among three Zoysia species: Z. japonica, Z. matrella, and Z. sinica. Each panel represents a pairwise comparison of genetic variation between two species, with the diagonal line indicating equal genetic contributions. The plots highlight the genetic relationships and differentiation among these species.
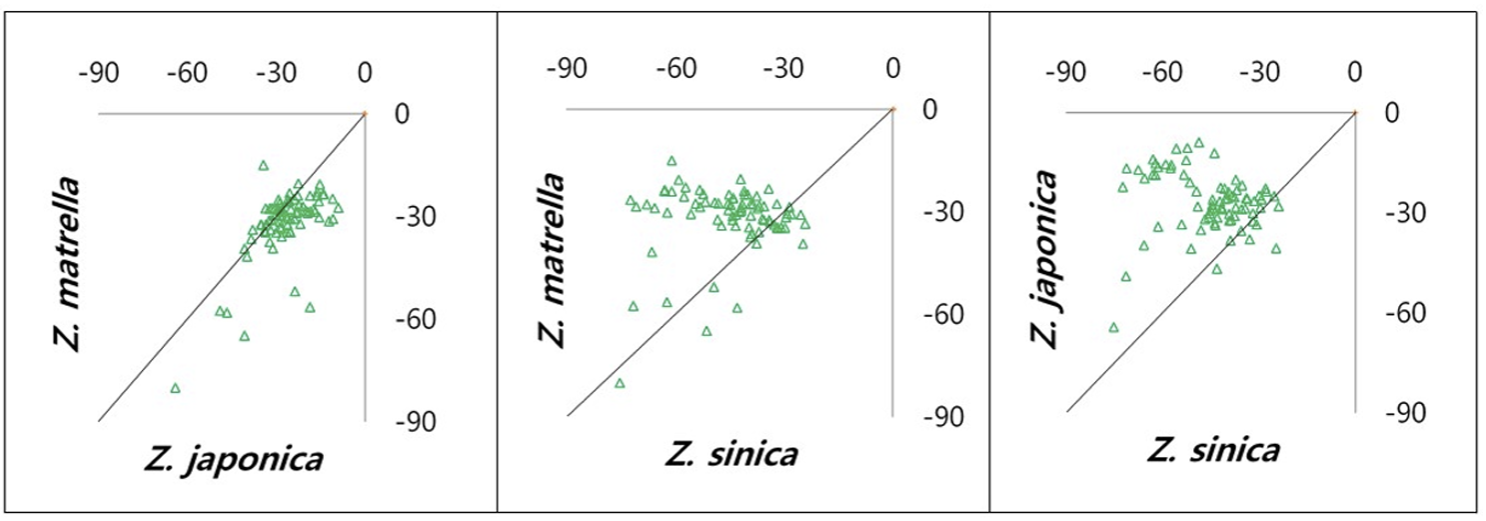
Fig. 8
Phylogenetic evolutionary relationships among Zoysia species along with a reference of bermudagrass (Cynodon dactylon). The dendrogram represents genetic relationships based on AFLP analysis, showing clustering patterns among Z. japonica, Z. koreana, Z. matrella, Z. tenuifolia, Z. macrostachya, and Z. sinica. Cynodon dactylon serves as an outgroup to root the phylogenetic tree.
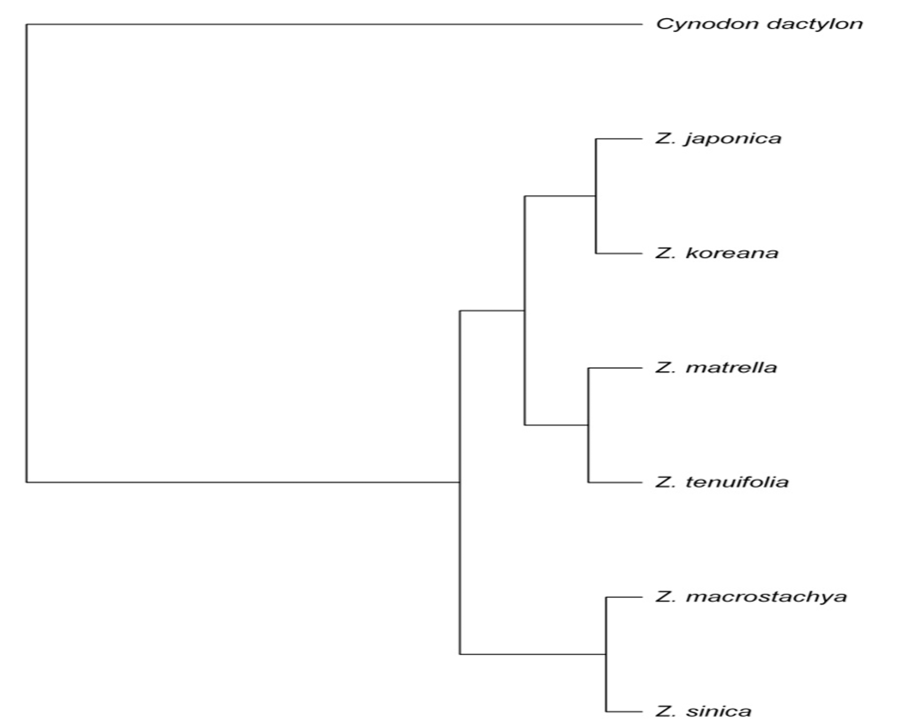
Fig. 9
Phylogenetic evolutionary relationships among Zoysia species by regional groupings. The dendrogram depicts genetic relationships within and among Zoysia species (>Z. japonica, Z. koreana, Z. matrella, Z. tenuifolia, Z. macrostachya, and Z. sinica) based on regional sampling (R1–R5). Cynodon dactylon serves as an outgroup. Clustering patterns illustrate genetic differentiation among species across different regions in South Korea.
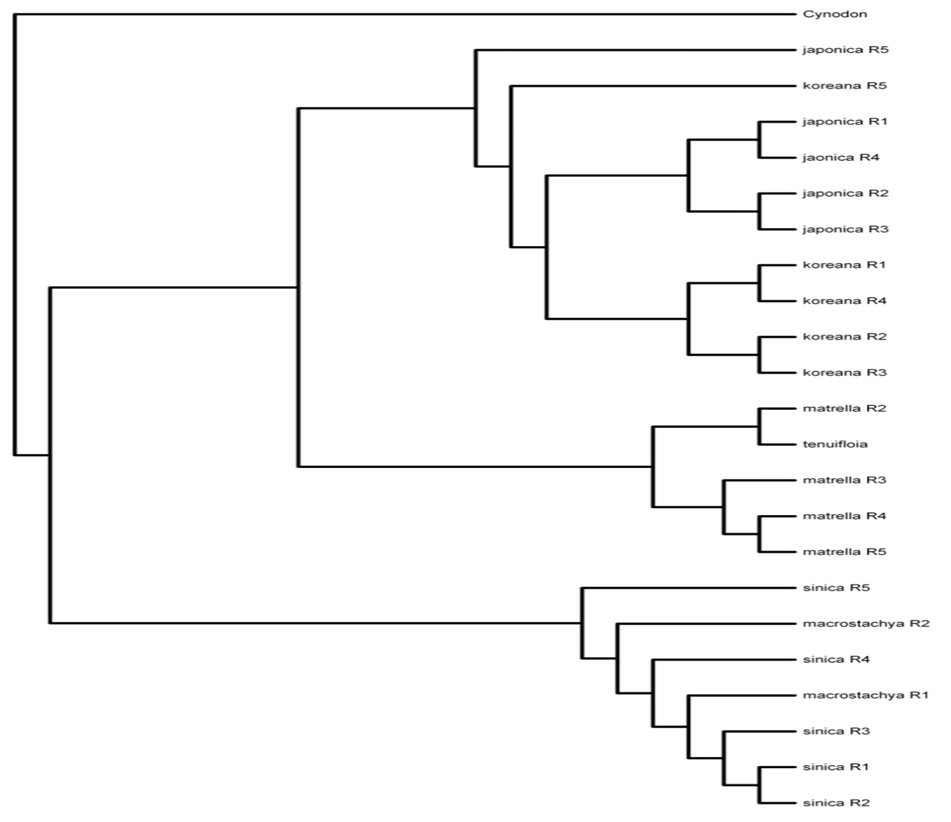
Fig. 10
Hybridization patterns in Zoysia koreana across hybrid categories based on Model I and Model II. The bar chart represents the percentage of individuals classified into various hybrid categories: BC1_jap (backcross with Z. japonica), BC1_sini (backcross with Z. sinica), F1 (first-generation hybrids), F2 (secondgeneration hybrids), Jap (Z. japonica), Sini (Z. sinica), and Unclear (ambiguous classification). Blue bars indicate results from Model I (Z. japonica × Z. sinica), while orange bars represent results from Model II (Z. japonica × Z. matrella), highlighting differences in hybridization patterns under the two models.
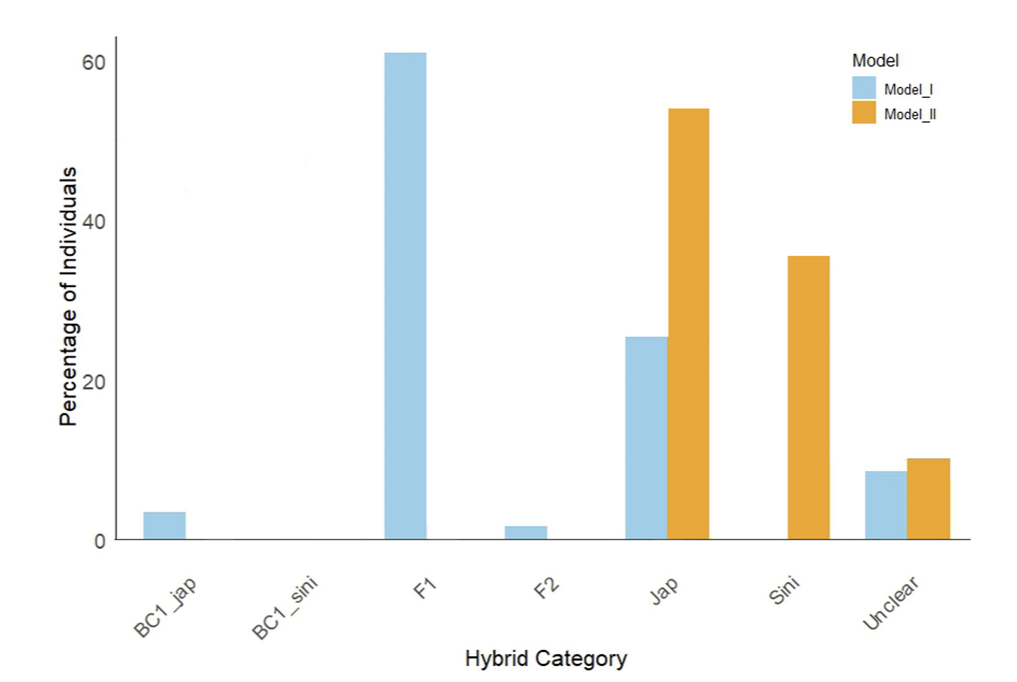
The phenomenon of hybridization has played a crucial role in the development of Z. koreana hybrids (Arnold and Martin, 2010; Mallet, 2007). Hybridization models indicate that the combination of Z. japonica and Z. sinica in Model I (M1) and Z. japonica and Z. matrella in Model II (M2) appears to have resulted in Z. koreana which reflected clustering analysis (Fig. 10). Due to its complex genetic background, Z. koreana shows a high proportion in the hybrid category in M1 (61.0%, F1) but a lesser proportion in the parental category (25.4%). In M2, Z. koreana exhibits higher parental similarity with Z. japonica (54.2%) and a moderate contribution from Z. matrella (35.6%) but lacks classifications in hybrid categories such as F1 and F2 (Supplementary Table 3). One potential adaptive advantage of hybridization in Z. koreana is increased genetic diversity, which may enhance its survival in the harsh situations of coastal environments. The hybridization patterns are further supported by the k-means clustering analysis, where Z. koreana was spread across several genetic groups, reflecting its mixed genetic heritage.
Kimball et al. (2012) and Tanaka et al. (2016) discovered significant genetic overlap between Z. japonica and Z. matrella, resulting in a variety of Zoysia hybrids. In our research, the hybrid character of Z. koreana was due to interspecific gene flow between Z. japonica and Z. sinica, which matched hybridization occurrences in Zoysia species. In addition, Choi (1997) and Yaneshita et al. (1997) studied Z. koreana’s stable hybrid nature and the high frequency of interspecific hybridization in Zoysia’s natural populations.
Conclusion
This investigation examined the stable genetic diversity of various Zoysia species from five distinct locations in South Korea using AFLP molecular markers. The study has critically demonstrated that the genetic diversity within the Zoysia population is significant and surpasses geographical differences. Hybridization was proven in Z. koreana from Z. japonica and Z. sinica, accompanied by a high level of polymorphism for the potent genomic shaping of Zoysia around the country. This research highlights the distinct genetic overlap and complex genetic structures influenced by hybridization among Zoysia species. These findings emphasize the critical role of hybridization and gene flow in shaping population structure, providing valuable insights for targeted Zoysia breeding, conservation efforts, and turfgrass management.
Acknowledgment
This research was funded by Digital Breeding Bridge Project (322071–03) of the Ministry of Agriculture, Food and Rural affairs in the Republic of Korea (MAFRA) and by the Forest Biomaterials Research Center, National Institute of Forest Science (Project No. FG0900-2020-01), Republic of Korea.