Introduction
The genus Echinochloa L. containing global malignant weeds, such as E. crus-galli (P.) L. Beauv., E. colona (L.) Link and E. crus-pavonis (Kunth) Schultes, is difficult to identify due to high morphological similarities and the existence of varieties within a species (Clayton and Renvoize 1999; Holm et al., 1977). It has been reported that there are approximately 30 to 40 species distributed from tropical to temperate. In Korea, E. crus-galli, E. oryzicola (Vasinger) Vasinger, E. oryzoides (Ard.) Fritsh and E. esculenta (A. Braun) H.Schol have been reported (Lee et al., 2014). Among these, the two species, E. crus-galli and E. oryzicola, are primary weeds in paddy fields. In particular, it is reported that E. crus-galli, one of the weeds causing severe yield losses in rice production, can reduce rice yield by more than 80% with only 20 individuals per square meter (Karl et al., 1997). The estimated economic thresholds (ET) of E. crus-galli were 1.2, 1.4, and 1.4 pants m-2 (Moon et al., 2011).
A repeated use of the same herbicide to an area where inhabit resistant weeds might lead to a worldwide serious problem as the evolution of herbicide-resistant weeds. It is known that six Echinochloa species are resistant to herbicides such as ACCase and ALS inhibitors in about 35 countries (Heap, 2018). In Korea, herbicide-resistant E. crus-galli (Im et al., 2009) and E. oryzicola (Im, 2009) have been reported so far in the genus Echinochloa. However, there is a possibility that E. oryzoides can develop herbicide resistance. In that case, this species will be a big problem because it forms a lot of tillers and produce vsery large amount of seeds (Lee et al., 2013).
Herbicide resistant weeds can be controlled by proper management at the early stage of development. It is important to select a proper herbicide to control the species and treatment stage. Identification of correct species or ecotypes is helpful for establishing an effective weed management strategy, since there are different sensitivities to the same herbicide among species or ecotypes of the same species (Warwick and Weaver, 1980). In addition, effective management of herbicide-resistant weeds requires an aggressive management strategy, such as predicting genetic diversity and distribution patterns among susceptible- and resistant- individuals and populations, and within population.
Attempts have been made to determine the genetic structure of the Echinochloa populations using allozyme or random amplified polymorphic DNA (RAPD) (Lopez-Martinez et al., 1999; Rutledge et al., 2000). Danquah et al. (2002) developed five microsatellites (EC1, EC2, EC3, EC4, and EC5) using E. crus-galli and E. colona to analyze interspecies genetic diversity. Lee et al. (2015) assessed the genetic diversity using Danquah et al.’s (2002) five microsatellite markers. They tried to understand population structure and possible origins of resistance among populations of ACCase inhibitor-resistant and -susceptible Echinochloa spp. in Korea. However, among the markers, EC4 showed no polymorphism and other markers were also found to have a relatively low polymorphism in assessing the genetic diversity of KoreanE chinochloa spp. susceptible and/or resistant to ACCase inhibitor (Lee et al., 2015). Lee et al. (2016) also studied phylogenetic relationship of Echinochloa based on microsatellites and morphology. They employed three markers, EC1, EC3, and EC5 and other markers developed for other Poaceae species such as pearl millet, sugarcane, sorghum, and foxtail millet. This urged us to develop additional markers for E. crus-galli and E. oryzicola.
Unlike economic crops, developing molecular markers for non-model species was very limited by high costs in the past. In recent years, however, the cost of mass analysis of nucleotide sequences has been very low, reducing the burden by using the next generation sequencing technology. Therefore, this study aimed to develop cross-specific microsatellite markers from Echinochloa crus-galli and E. oryzicola for assessing population structure and genetic diversity
Materials and Methods
Genomic DNA isolation and sequencing
Genomic DNA was isolated from frozen tissue of the single individual of Echinochloa crus-galli using DNeasy Plant Mini Kit (Qiagen, Germany) for next-generation sequencing (NGS) to screen microsatellite fragments. The whole genome DNA shotgun library was constructed with an average fragment size 500 bp and 5 Kbp using the sequencing platform manufacture’s protocol (Illumina, USA). Approximately 10 μg genomic DNA was subjected to the whole genome sequencing using an Illumina HiSeq2500 NGS platform at National Instrumentation Center for Environmental Management (NICEM, Seoul, Korea). Genomic DNA for validation and cross amplification of microsatellite markers developed in this study was also isolated from frozen tissues of the Echinochloa spp. using DNeasy Plant Mini Kit (Qiagen, Germany). Forty-eight individuals of E. crus-galli and 48 individuals of E. oryzicola were used for verification of cross-species microsatellite markers (plant material information is available upon request).
The 500 bp shotgun library sequencing data was filtered for high quality data isolation with at least 20 phred score by CLC software (CLC bio, a QIAGEN company, DK). Sequencing data were analyzed the k-mer frequency to estimate the genome size and heterozygous simulation using SOAPdenovo assembler based on the de Bruijin graph (Compeau et al., 2011; Li et al., 2010).
Then the sequences were assembled for contig construction using SOAPdenovo assembler. The contigs were reassembled to scaffold by linking the contigs using 5 Kb library mate-paired ends equencing data filtered with high quality phred score 20.
Detecting microsatellite, validation and genotyping
The program Microsatellite (MISA) search engine (http://pgrc.ipk-gatersleben.de/misa) was used to search for microsatellites within the assembled NGS data. The repeat types of microsatellite were determined from di- to hexa-nucleotide motifs. The microsatellite primers were designed for PCR products ranging from 100 to 400 bp on the flanking sequence of microsatellite loci using the PRIMER3 software package (Rozen and Skaletsky, 2000). The optimal primer length was set at 21, optimal annealing temperature was set at 55°C, and the remaining parameters were left at the default settings. The obtained di- and tri-nucleotide repeats were sorted according to the number of repeats bigger than eight using the data filter command in the Microsoft Excel program. Two hundred twenty-two tri-nucleotide repeats and 273 di-nucleotide repeats were selected for pilot PCR amplification with one individual of E. oryzicola and the other individual of E. crus-galli. A total of 245 microsatellite candidates, 153 trinucleotide repeats and 85 di-nucleotide repeats, were reselected after PCR amplification and subjected to caliper systems to filter the polymorphic microsatellite candidates on eight Echinochloa spp. individuals. Twenty-one candidates were selected for analyzing the genetic differentiation between E. crus-galli and E. oryzicola in Korea.
Fluorescence tag either as 6-carboxyfluorescein (FAM), hexachloro-fluoresceine (HEX), and Ned (Proprietary to ABI and its chemical structure is not available) was added to each forward primers of 23 microsatellite candidates for use in the multiplexes. For multiplexing PCR, each 12.5 μL PCR reaction included 1 μL genomic DNA (30-50 ng), 0.6 μL fluorescently labeled forward primer (5 μM; 6-FAM, HEX, and NED) and 0.6 μL reverse primer (5 μM each), 1.25 μL 10X buffer, 1.25 μL dNTPs (2 mM each), and 1.25 units F-Star Taq polymerase (Biofact, Korea). PCR amplification run as follows: 10 min initial denaturation at 95°C followed by 35 cycles of 30 s at 95°C, 30 s at 58°C, and 1 min at 72°C, and then 30 min at 68°C for a final extension. The amplified products were separated on an ABI3730xl DNA analyzer (AB-PEC, Foster City, USA) and the genotypes were determined using the Genemapper 4.0 (Applied Biosystems, USA) with visual inspection.
Basic statistics such as the major allele frequency, the number of genotypes, the number of alleles (NA), gene diversity (GD), heterozygosity, and polymorphism information content (PIC) were calculated using PowerMarkerv.3.25 (Liu and Muse 2005). Genetic distances between each pair of the individuals were measured by calculating the shared allele frequencies using PowerMarker v.3.25. FST (pairwise estimates of the correlation of alleles within subpopulations) for grouping by species was calculated by using an analysis of molecular variance (AMOVA) approach in GenAlEx 6.501 (Peakall and Smouse, 2006). Princpial coordinates analysis (PCoA) was performed to visualize similarities or dissimilarities of species using GenAlEx 6.501. For this analysis each species was divided into five and six groups based on the collection sites.
Results
Development and characteristics of microsatellite markers
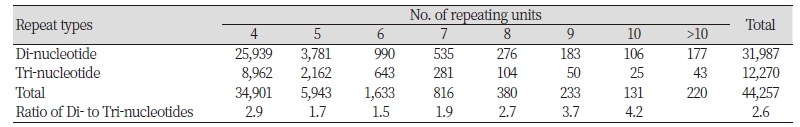
We obtained approximately 34 Gbp of sequence data containing a total of 1,246,270 assembled contigs and singletons for Echinochloa crus-galli from 337,650,586 sequence reads. K-mer analysis estimated the genome size of E. crus-galli as a 478 Mb. GC content was 43.9%. Among these sequences, a total of 683,671 microsatellites were identified. The most abundant type of repeat was 531,583 (77.8%) mono-nucleotide repeats followed by di-, tri-, tetra-, penta-, and hexa- nucleotide repeats. Of these, we only examined 44,257 di-/tri-nucleotide repeat motifs containing at least four repeats for further microsatellite discovery. Di-nucleotide motifs were 2.6 times more common than tri-nucleotide motifs (Table 1). [AT]n repeat was the most frequent, followed by [CT]n, [CA]n, and [GC]n in di-nucleotide motifs. In tri-nucleotide motifs, [GCG]n was the most frequent, followed by [AAG]n and [AGC] n while the [AGT]n was the least common. The difference between the most and least frequent motifs was 6.3- and 4.5-fold for di- and trinucleotide, respectively.
We sorted 222 primer pairs with more than seven repeats from tri-nucleotide repeat motifs and 283 primer pairs with more than nine repeats from di-nucleotide motifs using the data filter command in the Microsoft Excel program. Two hundred forty-five out of 505 primer pairs were PCR amplified and subjected to a microfluidic capillary system using eight individuals of Echinochloa spp. to select primer pairs showing polymorphisms and unambiguous alleles. Twenty-one microsatellite markers were polymorphic with three to nine alleles.
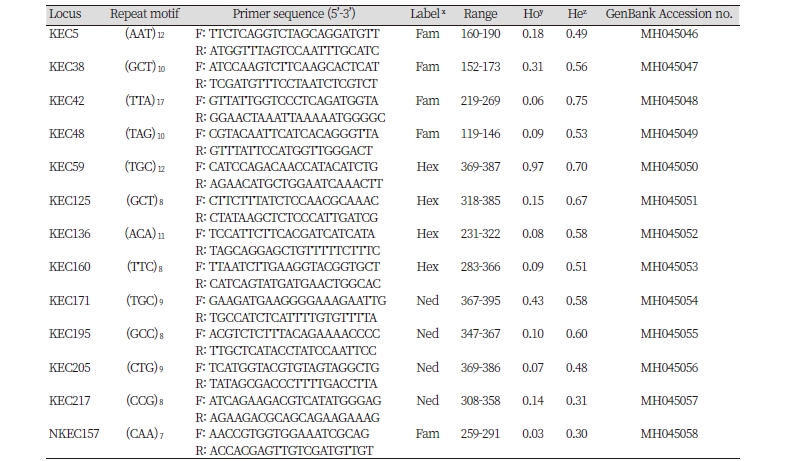
We genotyped 48 individuals of E. crus-galli and 48 individuals of E. oryzicola using 21 microsatellite markers for verification. Eight microsatellite candidates (38.1%) among 21 were not informative across the 96 individuals tested due to producing either monomorphic bands or no amplification for 96 Echinochloa spp. Finally, 13 tri-nucleotide repeat motifs were selected for common use in E. oryzicola and E. crus-galli. GenBank accession numbers are given from MH045046 to MH045058 (Table 2).
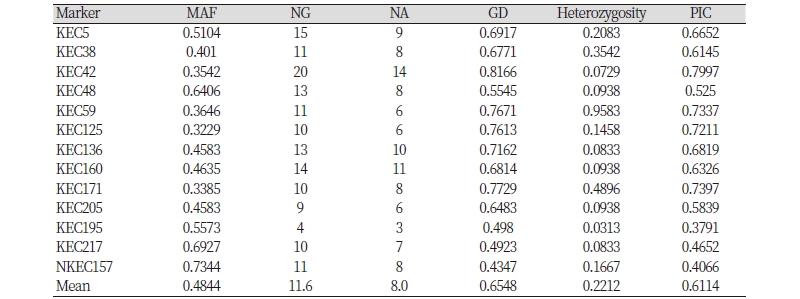
Newly developed 13 microsatellite markers were used to calculate the major allele frequency, the number of genotypes, the NA, GD, heterozygosity, and PIC. A total of 104 alleles, ranging from three (KEC195) to 14 (KEC42), was observed among the 96 individuals, with an average of 8.0 alleles per locus. The frequency of major alleles per locus varied from 0.323 (KEC125) to 0.734 (NKEC157). The averages of gene diversity and PIC values were 0.655 and 0.611l, with a range from 0.435 (KEC157) to 0.817 (KEC42) and from 0.379 (KEC195) to 0.8 (KEC42) respectively. Heterozygosity ranged from 3.1% (KEC195) to 95.8% (KEC59) with an average of 22.1% (Table 3).
Genetic differentiation between E. crus-galli and E. oryzicola
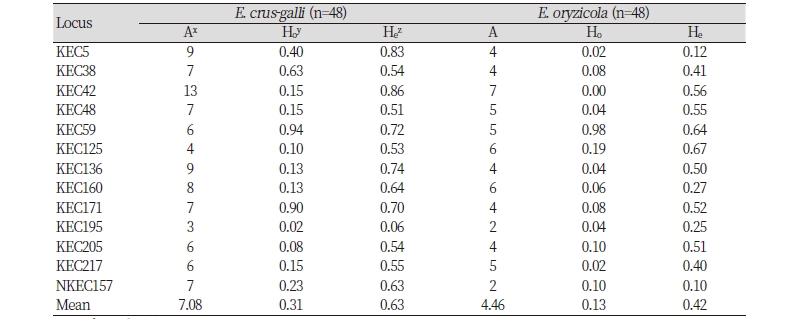
The number of alleles, observed heterozygosity, and expected heterozygosity for each marker were calculated in each species. The number of alleles ranged from two to 13, and the observed and expected heterozygosities ranged from 0.00 to 0.94 and from 0.06 to 0.86, respectively, across the two species. The average number of alleles were observed 7.08 and 4.46 for E. crus-galli and E. oryzicola, respectively (Table 4).
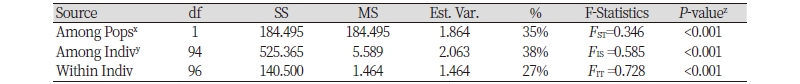
Genetic differentiation between the two Echinochloa species was estimated using 13 markers to validate the application. Gene diversity and PIC were higher in E. crus-galli (0.599 and 0.555) than in E. oryzicola (0.392 and 0.352) (Table 5). AMOVA results using fixation index (FST) pairwise value are presented in Table 6. Of the total variance, 35% resulted from the difference among the species, 38% from differences among individuals within species and 27% from differences within individuals. Pairwise estimates of FST among species at 0.346 (P <0.001) indicated a very great genetic differentiation between E. crus-galli and E. oryzicola based onthe Wright and Gaut (2005)’s qualitative guidelines for the interpretation of FST.

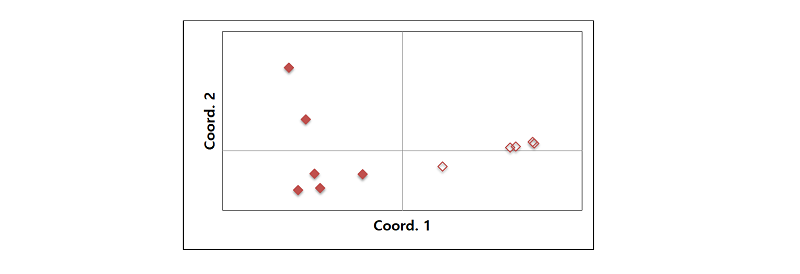
Principal coordinates analysis was used to evaluate the resolving power of the microsatellite markers. The species delineation was clear in the PCoA plot, that is, six E. oryzicola groups different from the other five E. crus-galli groups. Coordinate 1 explained 71.5% of variation (Fig. 1).
Discussion
Molecular markers are useful tools for efficient weed management as well as wide range of biological studies. Among them, microsatellites are one of the most popular molecular markers for genetic diversity and population studies. The use of molecular markers for weeds, however, was lagging behind other model plants because of a few available markers. Recently, NGS technology has made it easier to develop the molecular markers for non-model plants such as weeds and invasive species because NGS technology can save time and cost for microsatellite marker development (Nie et al., 2014; Pineda-Martos et al., 2014; Yu et al., 2011).
We tried to assess the genetic diversity of ACCase inhibitor resistant and –susceptible Echinochloa crus-galli and E. oryzicola populations in Korea (Lee et al., 2015) using microsatellite markers developed by Danquah et al. (2002). Only four out of five developed markers were employed for the genetic diversity assessment of Korean Echinochloa populations because EC4 did not show any polymorphism among the individuals. We found that those markers were not highly informative as well and we were urged to develop the better markers for assessing genetic diverstiy of Echinochloa.
We obtained 44,257 di-tri-nucleotide repeat motifs from 34 Gbp of sequence data. In this study, the di-nucleotide repeat motifs were more common, as many studies revealed dominance of di-nucleotide repeats over the other types (Nie et al., 2014; Yu et al., 2011). Although di-nucleotide motifs were 2.6 times more common than tri-nucleotide motifs, all the di-nucleotide motifs were showed ambiguous alleles in a validation using eight individuals of Echinochloa spp. We finally developed 13 polymorphic microsatellite markers from 12,270 tri-nucleotide repeat motifs in Echinochloa crus-galli. Average gene diversity (0.655) and the number of alleles (3-14) produced from each markers were very high comparing to those (0.35, 3-7) of microsatellite markers developed by Danquah et al. (2002). Thirteen polymorphic microsatellite markers were cross-specific for E. oryzicola although the number of alleles detected in E. oryzicola is more or less lower (4.46) than that inE . crus-galli, 7.08.
While we are developing these markers, Chen et al. (2017) also developed microsatellite markers using combination of restriction site-associated DNA and illumine sequencing technologies. They detected 3,081 putative microsatellites and validated eight out of them. They, however, only validated the eight markers using 20 Echinochloa crus-galli populations. With these, our 13 markers can be beneficial for assessing the population structure and genetic diversity of Echinochloa spp. which is problematic agricultural weeds.