Abstract
Figures & Tables
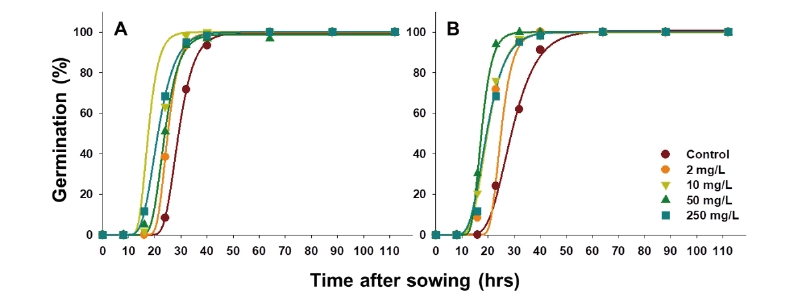
Fig. 1. Cumulative germination rate (%) of (A) and (B) treated with GA. The curves and symbols represent the fitted lines with the Gompertz model and the observed germination rates, respectively.
1Department of Plant Science, Research Institute of Agriculture and Life Sciences, College of Agriculture and Life Sciences, Seoul National University, Seoul 08826, Korea
2GBT2 PJT, LG Chem, LG Science Park, Seoul 07796, Korea
3Food Research Institute, CJ CheilJedang, Suwon 16495, Korea
Fig. 1. Cumulative germination rate (%) of (A) and (B) treated with GA. The curves and symbols represent the fitted lines with the Gompertz model and the observed germination rates, respectively.