Abstract
Rice plants were treated with either a low (50 µM, L-ALA) or a high (500 µM, H-ALA) concentration of 5-aminolevulinic acid (ALA) to find out the molecular mechanism underlying the ALA-caused modulation of porphyrin biosynthesis. Foliar application of H-ALA to rice plants developed necrotic symptom on leaves 2 days after the treatment, whereas no necrotic symptom was observed on leaves of L-ALA plants. After 2 days of ALA treatment, chlorophyll slightly increased in L-ALA plants, but decreased in H-ALA plants. While H-ALA treatment greatly decreased ALA-synthesizing capacity, L-ALA treatment did not show a significant change in ALA-synthesizing capacity. Plants treated with H-ALA exhibited a greater decline in transcript levels of
Figures & Tables
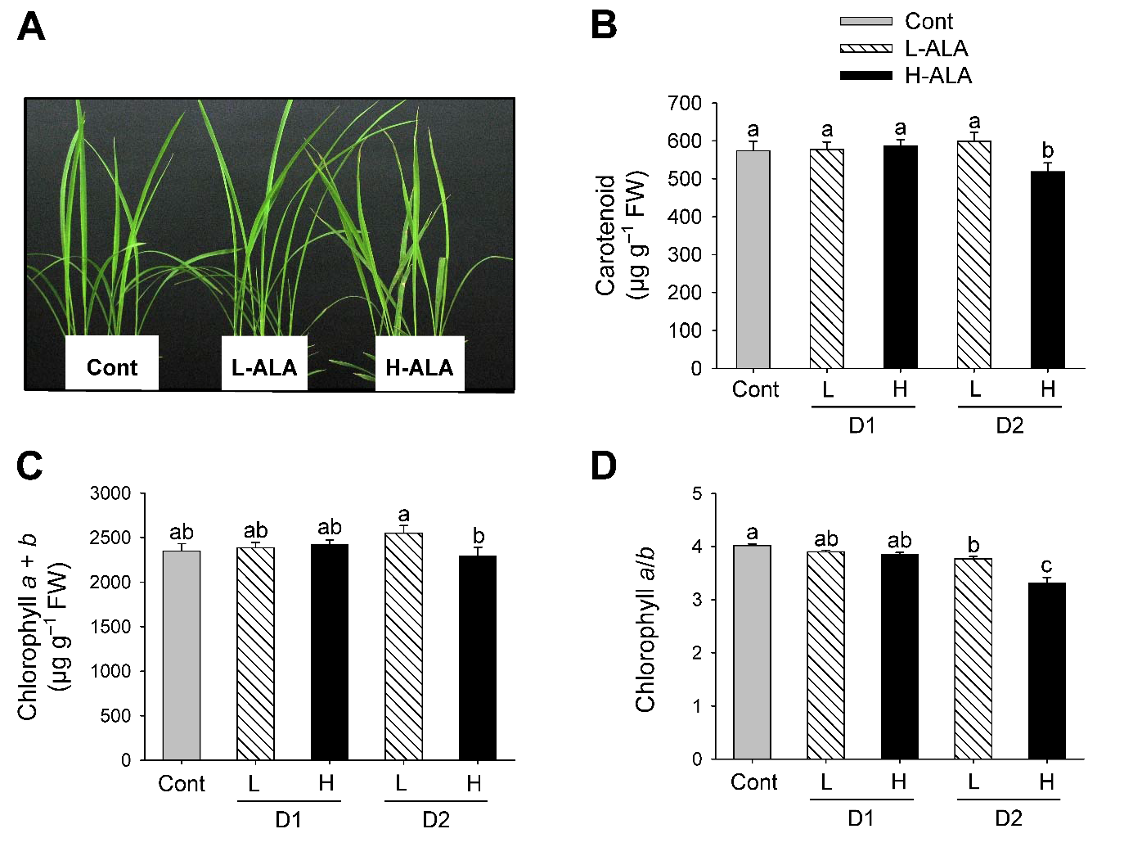
Fig. 1.Effect of exogenous 5-aminolevulinic acid (ALA) treatment on phenotypes and photosynthetic pigments in rice plants. (A) Necrotic phenotype. Photographs were taken 2 days after ALA treatment. (B) Carotenoids. (C) Chlorophyll. (D) Chlorophyll a/b ratio. Rice plants at the three-leaf stage were sprayed with either a low (50 μM) or a high (500 μM) concentration of ALA. Cont: Control (water with 0.1% Tween-20); L-ALA: A low concentration (50 μM) of ALA treatment; H-ALA: A high concentration (500 μM) of ALA treatment; D1: 1 day after ALA treatment; D2: 2 days after ALA treatment. Treatment notations are the same as in Fig. 1. The data represent the mean±S.E. of 6 replicates. a-c: Means denoted by the same letter did not differ significantly at P<0.05 according to Duncan’s multiple range test.