Growth Characteristics and Infiltration Rate in Kentucky Bluegrass, Perennial Ryegrass and Tall Fescue Grown under California Soil System in Soccer Field

Kyoung Nam Kim1,*   Se Eun Kim2   

1Dept. of Environmental Design and Horticulture, College of Science and Technology, Sahmyook University, Seoul 01795, Korea
2Dept. of Environmental Horticulture, Graduate School, Sahmyook University, Seoul 01795, Korea

Abstract

This study was conducted to compare growth characteristics and infiltration rate in major cool-season grasses (CSG) under California soil system and to provide basic information on sports turf design, construction and maintenance. Treatments were comprised of Kentucky bluegrass (KB, Poa pratensis L.), perennial ryegrass (PR, Lolium perenne L.) and tall fescue (TF, Festuca arundinacea Schreb.). Significant differences were observed with CSG and season. Turfgrass density increased with PRPR>KB, and it did not increase in summer due to summer drought. KB, however, produced greatest root growth in late June and early October. Evaluation on rooting development showed the similar results as root growth. Overall thatch accumulation ranged from 11.93 to 14.12 mm, being 2.19 mm in differences among CSGs. This resulted from inconsistent, seasonal raking among turfgrass entries. Infiltration rate was greatest in order of KB>PR>TF, regardless of season. It was highly related to turfgrass growth-type and soil pore. There were consistent responses to growth characteristics, being greatest in May and lowest in early October. Growth habit and rooting characteristics had a great effect on drainage capacity. Shoot-growth type and root growth pattern are variable with turfgrasses. Water infiltration rate more easily decreased with a B-type TF and PR as compared with an R-type KB.

Figures & Tables

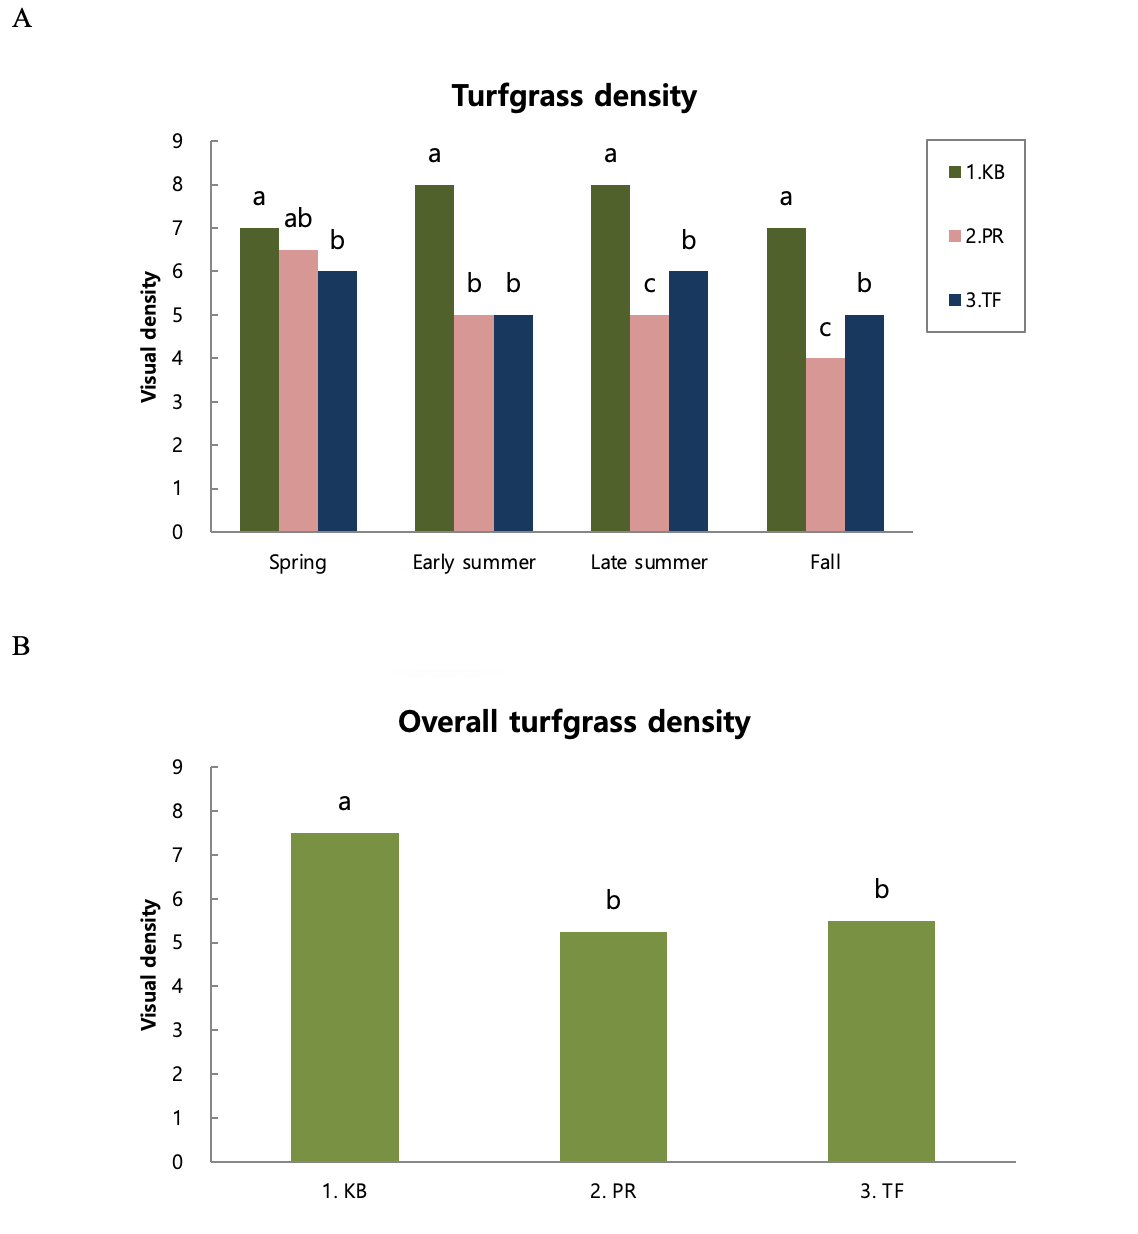
Fig. 1.Seasonal (A) and overall (B) turfgrass density of major cool-season grasses in California system. KB, PR, and TF represent Kentucky bluegrass, perennial ryegrass and tall fescue, respectively. a-c: Bars with different letters are significantly different based on Duncan's multiple range test at P=0.05.