Abstract
In this study,
Figures & Tables
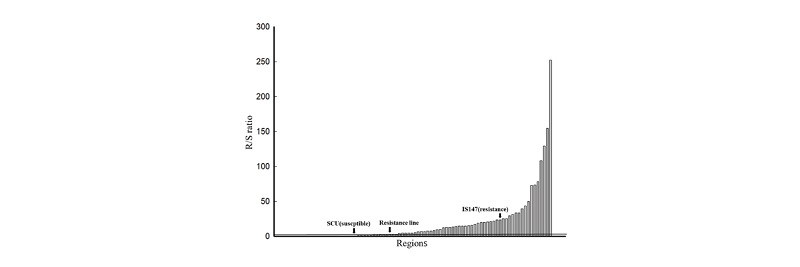
Fig. 1.R/S ratio of resistant to susceptible in Gyeongnam province. GC: Geochang-gun; HC: Hapcheon-gun; CN: Changnyeong-gun; MY: Miryang-city; US: Ulsan-metropolitan-city; HY: Hamyang-gun; SNC: Sancheong-gun; UY: Uiryeong-gun; HA: Haman-gun; CW: Changwon-city; GH: Gimhae-city; YS: Yangsan-city; HD: Hadong-gun; JJ: Jinju-city; BS: Busan-metropolitancity; SC: Sacheongun; GS: Goseong-gun; NH: Namhae-gun; TY: Tongyeong-city; GJ: Geoje-city. The regions on the X axis correspond to the respective regions corresponding to the R/S ratio of Table 1.